
| Level | Label | Explanation |
|---|---|---|
| ⬜⬜⬜⬜ | None | This is not included in the course. |
| ⬛⬜⬜⬜ | Incidental | This may or may not occur in the course. |
| ⬛⬛⬜⬜ | Teacher | This is demonstrated to students, but they are not necessarily expected to do it independently. |
| ⬛⬛⬛⬜ | Student | Students are expected to do this independently, but it may not be formally assessed. |
| ⬛⬛⬛⬛ | Assessed | Students are expected to do this independently, AND it will be assessed for proficiency. |
1 Introduction
As programs in data science have sprung up worldwide over the past decade, a consistent vision for an undergraduate curriculum in data science remains insufficiently articulated, let alone adopted. A decade ago, Hardin et al. (2015) described several early courses in data science, revealing some commonalities but also vast differences in approaches and topics covered. Soon after that, De Veaux et al. (2017) imagined an innovative, holistic experience in data science, but such truly interdisciplinary courses remain more exceptional than common. While influential groups like National Academies of Sciences, Engineering, and Medicine (2018) have broadly defined the goals and learning outcomes for data science majors, they have not offered a blueprint for a series of courses. Donoho (2017) grappled with the big, hard questions about what makes data science a science, but similarly gave us six divisions of “Greater Data Science” and left us to figure out the details. ABET, formerly known as the Accreditation Board for Engineering and Technology, Inc. (Blair et al. 2021) has brought the imprimatur of accreditation to such programs, but also articulates only program- and student-level outcomes. Posner and Kerby-Helm (2025) as part of the NSF-funded MASDER (Motivational Attitudes in Statistics and Data Science Education Research) project have synthesized professional recommendations into a set of Data Science Program Topics, but this has not yet been aligned with curricula.
While these and other authors and panels of experts have articulated program-level goals for undergraduate data science curricula, De Veaux et al. (2017) were among the first and only commentators to offer details on the composition and learning goals of specific courses in an undergraduate data science program. De Veaux et al. (2017) imagined a curriculum for a data science major that was freed from the constraints of departmental turf wars and existing curricula that reflect the reality at most institutions.1 Their vision included four foundational courses—a two-course sequence in mathematics specifically for data science and a two-course sequence in data science itself—opening up into upper-level courses ranging from statistical modeling and machine learning to algorithms and data curation, and culminating in a capstone experience. The envisioned two-course sequence in mathematics would combine elements of several traditional courses from the undergraduate mathematics curriculum (e.g., calculus, linear algebra, geometry, and probability), while the two-course sequence in data science would help establish data science as its own field, with its own unique foundational structure.
However, despite a decade of robust curricular growth in data science since Hardin et al. (2015), the data science courses that provide the glue to these data science programs lack the standardization that adjacent disciplines like mathematics, computer science, and statistics have developed over the years. If a student takes a course in linear algebra, data structures, or introductory statistics at virtually any college in the United States, it is highly likely that they will be able to transfer those credits to another institution and fulfill a corresponding requirement because those courses are relatively standardized across institutions. The Mathematical Association of America (MAA), the Association for Computing Machinery (ACM), and the American Statistical Association (ASA) have expended a great deal of energy to make it so.
But it is not yet so with data science, where, for example, an introductory data science course at one institution is far less likely to fulfill a requirement at another institution. Table 1 in Çetinkaya-Rundel and Ellison (2021) illustrates that across five introductory data science courses at five different institutions, the estimated percentage of class time spent on modeling ranges from 0% to 35%, as does the estimated percentage spent on mathematical foundations and theory. As we will show, similar discrepancies exist across the five intermediate data science courses at our respective institutions. For example, while all of our courses address ideas like iterating a function over a list of input values and pushing commits to a GitHub repository, only some address statistical modeling or software development at all.
At the program level, standardization efforts are underway. Recently, the MAA, ACM, and ASA along with the Academic Data Science Alliance (ADSA), the Institute for Operations Research and the Management Sciences (INFORMS), and the Society for Industrial and Applied Mathematics (SIAM), created a joint Data Science Curriculum Task Force. This group is focused on program-level curriculum (i.e., core knowledge areas) and not course-specific guidelines, and their recommendations have not yet been published (Leidig et al. 2026). Posner and Kerby-Helm (2025) provides structure to data science by identifying topics, sub-topics, and competencies/concepts in data science.
To date, the lack of a standardized curriculum in data science has caused relatively little chaos because many curricula in data science rely largely or entirely on a package of longstanding courses in adjacent disciplines, with perhaps a flexible, project-based capstone experience at the end. Thus, it is currently the standardization of the courses not labeled data science that provides some curricular consistency of data science programs. Recent curriculum guides from the MAA (Schumacher and Siegel 2015), ACM (Danyluk and Leidig 2021), and ASA (Carver et al. 2016) all touch on data science, but still fail to deliver standardization. Without consensus and coordination, this situation is likely to get worse in the near future. Baumer and Horton (2023) illustrate how the lack of curricular standards in data science becomes especially problematic at the interface between two-year and four-year colleges.
As data science matures as a discipline, programs in data science cannot simply be a grab bag of courses from other programs. If students are simply choosing two courses from this pile, one from that pile, etc., there is no explicit scaffolding and connection between courses in their educational journey. Standardized courses in data science, especially early courses, can provide essential foundational structure that future courses can build on in a systematic manner.
1.1 A first course in data science
Several visions for a first course in data science (a.k.a., DS1) have been articulated. Yan and Davis (2019) describes a course targeting first-year students, Baumer (2015) describes a course targeting advanced undergraduates, and Hicks and Irizarry (2018) describes a course targeting graduate students. In the discipline-free vision of De Veaux et al. (2017), the DS1 course has many similar elements as these other courses, although they de-emphasize data wrangling in favor of the inclusion of ideas in modeling, simulation, and algorithmic thinking. But key learning goals still include “exploring and wrangling data” and “summarizing, visualizing, and analyzing data,” with “R recommended” as the high-level programming language.
As expected with an emerging discipline, consensus around what topics should be included in such a course has been slow to build. For example, the question of whether a first course in data science should include statistical inference remains open. The course described in Baumer (2015) later morphed into an introductory course that deliberately does not include statistical modeling and inference, while several of the courses described in Çetinkaya-Rundel and Ellison (2021) do include statistical modeling and inference. Numerous textbooks (Irizarry 2019; Baumer et al. 2021; Ismay and Kim 2019) support either format.
Despite the lack of standardization, two topics consistently appear as focus areas of a first course in data science: data wrangling (e.g., using the dplyr (Wickham, François, et al. 2026) package to transform, reshape, and summarize rectangular data) and data visualization (e.g., using the ggplot2 (Wickham, Chang, et al. 2026) package to draw scatterplots, boxplots, or other graphical displays of data) (Hardin et al. 2015; Yan and Davis 2019; Baumer 2015; Hicks and Irizarry 2018; Çetinkaya-Rundel and Ellison 2021; Lasser et al. 2021; Brunner and Kim 2016; Xiao et al. 2021). Additionally, we perceive broad consensus that a first course in data science should include significant exposure to a high-level programming language, which is nearly always R or Python. Thus, regardless of whether a first course in data science includes statistical inference, statistical modeling, or a more computational skill (e.g., how to query a database), such a course at any imaginable institution is highly likely to engage students with coding in either R or Python and develop the capacity for students to wrangle and visualize data. Other common data science concepts that appear in first courses include ethics, workflows, and the data science lifecycle (Wing 2019; Stodden 2020).
1.2 Recent models for a second undergraduate course in data science
While the specifics of a first course in data science continue to coalesce, we turn our attention to the second course in data science (a.k.a., DS2). Even though the exact learning outcomes of the first course remain nebulous around the edges, there is enough consensus to proceed with the expectation that students in a second course in data science will have the aforementioned foundational skills for data wrangling and data visualization in R and/or Python. In this paper, we explicate several recently developed versions of a second course in data science that further develop data science skills. We hope that these courses will provide instructors and curriculum designers with a sufficiently diverse set of courses and topics to build out their own curricula. Here again, we hope these courses will be particularly influential for two-year colleges, who will likely need to develop a second course in data science soon (Baumer and Horton 2023). In Section 5.2, we also situate these courses in relation to the vision for DS2 articulated by De Veaux et al. (2017) and other existing course models.
Our small group of authors cannot define for the field what DS2 is. What we can do is provide five examples of DS2 courses that are working well at our respective institutions (Section 2), analyze the content of these courses (Section 4), contextualize those results within other articulated models for non-introductory data sciences courses (Section 5.2) and the broader data science curriculum (Section 3.3), and explain our methodology (Section 3) while acknowledging its limitations (Section 5.3)
We also draw boundaries that delineate how we think DS2 differs from other intermediate courses that are often part of data science curricula (see below). While not what we have in mind for a second course in data science, these statistics and computer science courses provide good examples of how a second course in a discipline builds on the grounding from a first course to expand fundamental knowledge in that discipline.
We do not see DS2 as a second or third course in statistics. A second course in statistics typically focuses on statistical modeling and/or experimental design, and is well supported by a variety of textbooks, including Cannon et al. (2019), Ramsey and Schafer (2013), Kuiper and Sklar (2012), Sheather (2009), and Cobb (1998). Any number of third courses in statistics might focus on more advanced techniques in statistical modeling, for example hierarchical or multilevel models, random effects models, generalized linear models, or Bayesian models (see, among many, Roback and Legler (2021)).
We also do not see DS2 as a second course in computer science, which often focuses on data structures (CC2020 Task Force 2020).
Finally, our second courses in data science are also not courses in machine learning (Bishop and Nasrabadi 2006) or statistical learning (James et al. 2013), which are important parts of a data science curriculum that we believe merit their own course or courses. We view these courses as excellent applied courses at the intersection of statistics, computer science, and data science, especially once a foundation has been formed in one or more of those disciplines, and we offer them as standalone courses in our curricula.
Among the courses we describe, there is agreement in further developing data science programming skills and emphasizing data science workflow through the use of version control tools (see Section 4). The particular courses, however, range from the very technical (e.g., building a package; see Section 2.4) to the very broad-minded (e.g., data storytelling; see Section 2.2).
1.3 Paper outline
To the best of our knowledge, this paper represents the first wide-ranging attempt to provide models for a second course in data science2. In Section 2, we briefly describe the five courses3 that serve as case studies for a second data science course. In Section 3, we describe how these five courses were selected and the process by which we map learning outcomes from our five exemplar courses to the topics, sub-topics, and competencies that grew out of the MASDER project. In Section 4, we summarize common threads and unique aspects about the courses in terms of topics and competencies. Finally, Section 5 offers a discussion and closing thoughts.
2 Course Descriptions
All five courses are taught in a lecture format that incorporates in-class lab opportunities for about 20-40 students (see Table 1). They all build on data science skills developed in a first course in data science, and all but one of the courses build on data or programming skills developed in an introductory computer science and/or an introductory statistics course. In this section, we provide a short narrative about the course context and its development, syllabus learning goals, content and structure, student assessment, and some reflections by both instructor(s) and students.
| Course Title | Institution | Prerequisites | Structure | Size | Software |
|---|---|---|---|---|---|
Data Science 2 (SDS 264) |
Saint Olaf College Northfield, MN |
DS1 (R) | Lecture with in-class labs | 27 | R, RStudio |
Intermediate Data Science (COMP/STAT 212) |
Macalester College Saint Paul, MN |
DS1 (R), Intro computer science (Python), and Intro statistics (R). | Lecture with in-class labs | 20 | R, RStudio |
Intermediate Data Science (STAT 5910) |
Villanova University Villanova, PA |
DS1 (R), Intro statistics, and some programming experience | Lecture with in-class labs | 15 | R, RStudio |
Programming for Data Science in R (SDS 270) |
Smith College Northampton, MA |
DS1 (R) and Intro computer science (Python) | Lecture with in-class labs | 40 | R, RStudio |
Data Science in Python (SDS 271) |
Smith College Northampton, MA |
DS1 (R) and Intro computer science (Python) | Lecture with in-class labs | 40 | Python, Jupyter notebooks |
In Section 2.1, we describe a course taught at St. Olaf College by Paul Roback and Joe Roith called “Data Science 2” that helps students become more proficient in computing aspects of data science while gaining experience with the data science workflow through a series of creative projects. In Section 2.2, we describe a course taught at Macalester College by Leslie Myint and Brianna Heggeseth called “Intermediate Data Science” that develops students’ abilities to tell stories with real data, through a variety of mechanisms. In Section 2.3, we describe a course taught at Villanova University by Michael Posner called “Intermediate Data Science” that covers text mining, interactive data visualization, and introduces students to data science tools. In Section 2.4, we describe a course taught at Smith College by Ben Baumer, Albert Kim, and William Hopper called “Programming for Data Science in R” that culminates in students building an R package. In Section 2.5, we describe a course taught at Smith College by Gillian Beltz-Mohrmann called “Programming for Data Science in Python” that culminates in students building a Python package.
2.1 A course that focuses on literate programming and data science workflow
SDS 264: Data Science 2 debuted in spring semester of 2024 at St. Olaf College4, the result of two forces within the Statistics and Data Science program. First, the Introduction to Data Science course that we had been teaching since spring semester of 2018 had become so packed with content and moved so fast for many students that it was no longer an “introductory” experience. As a result, we shifted about two-thirds of the material to a 100-level DS1 course that was truly introductory, with a primary focus on data wrangling and data visualization in R. The other third of the material, along with many topics we had always wanted to include, became a 200-level DS2 course which built on the fundamentals gained in DS1. Second, in 2024, we were converting a concentration in Statistics and Data Science to a full-fledged major, and we envisioned an early, well-defined core set of two courses in data science to parallel an early core set of two courses in statistics.
SDS 264 recognizes that there are many fundamentals of literate programming (Knuth 1984) that a modern data scientist should possess that are not covered in DS1. We therefore focus on many of those fundamentals in the presence of real data and real questions. Examples include writing functions (to perform common tasks efficiently), iteration (to effectively loop through similar instances), regular expressions (to clean and analyze text data), data acquisition (to acquire analyzable data from websites, APIs, and other sources), data types (to gain a deeper understanding of the R programming language), version control (to work well in group settings), and structured query language (SQL, to wrangle even larger data sets). Students then apply these newly mastered fundamentals to several areas of application, including mapping, text analysis, webpage creation, and dynamic graphics and dashboards. We hope to expand students’ understanding of data beyond traditional columns of numbers and plots like scatterplots and barplots. SDS 264 students become more proficient in the computing aspects of data science while gaining experience with the data science workflow and remaining grounded in real data. They also gain an expanded set of tools for discovery and decision making with data.
We remind students that DS2, like DS1, is not a substitute for coursework in statistics, where they study core ideas like study design, variability, and inference at a deeper level, nor is it a substitute for coursework in computer science, where they study algorithms and systems at a deeper level, or mathematics, where they study patterns and order, learning the language of modeling and probability (among other ideas).
2.1.1 Learning goals
Students completing SDS 264 at St. Olaf will be able to:
- Use efficient and literate coding practices such as iteration, functions, and regular expressions
- Extract data from databases using structured query language
- Scrape data from websites and other sources to create analyzable data sets
- Create meaningful choropleth maps
- Produce dynamic graphs that a user can interact with
- Work in data science teams using version control and other sound workflow practices
- Tell stories with data while carefully considering ethical implications
Additionally, we hope that by the end of SDS 264, each student has developed a skill set and tangible products that would impress a future interviewer, as well as teaching their professor and their classmates at least one new thing about this quickly-moving discipline of data science.
2.1.2 Content & Structure
Before the first day of class, students are asked to install R and RStudio, as well as Git and GitHub, on their own computers. This immediately signals a break from DS1 and any previous statistics courses they may have taken, which typically rely on the RStudio Server maintained by St. Olaf’s IT Department. While reviewing data wrangling and data visualization from DS1, students begin to learn version control using GitHub in the RStudio environment, as well as focus more attention on the quality of their code.
Next, strings and regular expressions are presented, allowing students to perform some simple but motivating text analyses. We then shift to key computational building blocks in data science, including functions, iteration, and data types. While computer science majors may have experience with these ideas, many students are exposed to them for the first time. These building blocks are immediately put to use for data acquisition, using APIs and R packages, or by directly (and ethically) scraping tables and web pages. Students are then given the opportunity to create personal web pages with Quarto (Scheidegger et al. 2022), which provides a vehicle for illustrating project work and source code to those students who choose to make theirs public.
A mini-project with choropleth maps provides an immediate, visually arresting example of data storytelling to include on their web page. Each student also produces an “R Tip of the Day” as a way to explore new packages as well as features of presentations using Quarto. Before starting their final project, students spend time learning SQL (a popular request of employers). This helps them see how their knowledge of dplyr (Wickham, François, et al. 2026) verbs in the tidyverse (Wickham 2023) has set them up well to understand SQL logic. We are extremely grateful that our IT Department created a server to house a data warehouse that students can query, since publicly available SQL databases are hard to find. Our students make their SQL queries within the RStudio environment in order to build custom data sets that they can examine with their data wrangling and visualization skills. Finally, students complete and present final projects in pairs—building shiny (Chang et al. 2026) apps for interactive storytelling based on data they’ve already acquired and wrangled themselves.
All course materials are posted to a course web page; these materials are based on the free-to-read textbooks by Wickham et al. (2023), Baumer et al. (2021), and Irizarry (2019), materials graciously shared by several co-authors on this paper, and homegrown materials. In the first edition of this course, we also attempted to cover networks, simulation, and spatial data, but these topics proved to be overly ambitious and were removed before the second edition. Simulation and spatial data, in particular, are both covered more fully in other courses available in the department.
2.1.3 Assessment of students
Most courses in the SDS program at St. Olaf have similar breakdowns of assessment methods, featuring meaningful weekly or bi-weekly homework sets, several exams that combine in-class and take-home components, and a final group project. Assessment in SDS 264, on the other hand, is heavily weighted toward a series of mini-projects preceding a final project. These mini-projects give students a chance to apply recently developed skills to data and questions of their own choosing. They can decide which data they’d like to acquire and how they’d like to construct a shiny (Chang et al. 2026) app to allow others to explore and gain insights. They create their own personal web page and then build pages showing choropleth maps and text analyses of works and variables they selected. Two or three knowledge quizzes are built in to check understanding of technical details, and periodic homework is collected to encourage practice with new ideas. But most of the assessment is weighted toward projects that allow students to follow their passions and display their creativity and storytelling abilities.
2.1.4 Instructor & student reflections
By the fourth edition of SDS 264 at St. Olaf (Fall 2025), a more settled curriculum and other changes led to (mostly) positive student evaluations. Comments included:
“[The] professor lets us do many projects on our own using lessons from class and to me, it’s the best way to practice my skills but also combine my interests with those skills.”
“I had a lot of fun working on the projects and R Tip of the Day and felt very proud when presenting my projects.”
“Thank you so much for creating such an exciting class… I honestly learned more than I ever expected, [and] I feel like I am one step closer to becoming a real data scientist.”
Besides removing several topics as discussed above, changes from the first to the fourth edition included waiting before creating Quarto (Scheidegger et al. 2022) websites to reduce the initial burden, intentionally teaching students how to resolve merge conflicts in GitHub, adding knowledge quizzes for short check-ins on technical details, improving the project rubrics and instructions to provide more direction, using our own server for SQL queries, and improving the class activities around data acquisition.
Future editions will enact much smaller changes, as recent students showed solid understanding of the fundamentals of literate programming for data science through knowledge quizzes and project work, and they produced an impressive and creative set of Shiny apps for their final projects. Final project topics included text analyses of how newspapers portrayed ethnic groups before and after the attack on Pearl Harbor, the presence and migratory movement of loons and geese, and strategies for profiting in a popular online farming simulation game.
Nevertheless, some content of SDS 264 can be a moving target as technology constantly changes. Since the first edition in Spring 2024, new and useful R packages have appeared, Quarto has become more mainstream for the creation of web pages and dashboards, government data sources and APIs became unreliable (sometimes overnight), and large language models (LLMs) have simplified many tasks, such as the creation of shiny (Chang et al. 2026) apps. For professors whose formal training did not include many DS2 topics, keeping up-to-date can be a non-negligible challenge that is simultaneously exhilarating and exhausting.
2.2 A course that focuses on data storytelling
We envisioned COMP/STAT 212: Intermediate Data Science at Macalester College5 as a critical bridge course between the introductory data science course (DS1) and the project-based capstone experience. Macalester’s data science curriculum dates back to Fall 2017 with the debut of the DS1 course, which expanded upon a successful 1-credit “Data and Computing Fundamentals” course developed by Daniel Kaplan. Simultaneously, the department launched its project-based capstone in data science. Despite early progress at the introductory and advanced levels, students were left to navigate the significant gap between the two without an intervening opportunity to further develop their technical skills. To address this, we intentionally designed the Data Science major around three core data science courses that gradually build proficiency and share a focus on iterative data storytelling. These courses complement existing Statistics, Mathematics, and Computer Science offerings. Although the Data Science major officially launched in Fall 2021, we deferred the implementation of this intermediate bridge until Fall 2023.
The intermediate data science (DS2) course builds upon and deepens the data visualization, data wrangling, and data communication skills developed in DS1. We challenge students to deconstruct the fundamental building blocks of visualizations, expanding their capacity for sophisticated and effective data storytelling. To support these goals, the course incorporates programming in R, which facilitates advanced data acquisition and more complex wrangling and visualization workflows. The course culminates in a final project where students create a digital artifact using at least two data sources. This project requires students to craft an honest and ethical narrative, resulting in a professional output suitable for a public portfolio for sharing with prospective employers.
2.2.1 Learning goals
Students completing COMP/STAT 212 at Macalester will be able to:
- Work collaboratively with Git/GitHub
- Incorporate input to formulate and refine research questions that can be answered with data
- Use current professional data science tools in the tidyverse (Wickham 2023) package to acquire, wrangle, and visualize data accurately and ethically
- Incorporate documentation and reproducibility in data acquisition, management, and analysis to promote transparency and accountability
- Construct and present effective data narratives, ensuring that they effectively communicate the significance and limitations of the findings through various mediums, including static and interactive data visualizations, presentations, and written reports in Quarto (Scheidegger et al. 2022)
2.2.2 Content & Structure
We structure the course to interweave data science workflow topics with technical computational skills. In particular, every class period starts with a data storytelling moment in which students engage with an existing data visualization and reflect on the story communicated, the concrete features that make it effective, and the ways it could be improved.
We start the semester with a discussion of file organization and an introduction to the basics of Git/GitHub, which are important tools for starting a new data project. We then review ggplot2 (Wickham, Chang, et al. 2026) functions and consider more customized visualizations by discussing a wider variety of geom_*() functions and spatial tools such as coordinate reference systems and functions in the sf (Pebesma 2026) package. Students tackle technical skill challenges individually on these topics and use GitHub to turn in their work. We then move on to advanced data wrangling and cover subtleties of data types as described in Wickham et al. (2023), with an emphasis on checking assumptions about the data during transformation to ensure accuracy.
We discuss missing data assumptions (e.g., missing at random, missing completely at random, and missing not at random), and how these assumptions impact appropriate wrangling approaches and future data narratives. Demonstrating imputation techniques, such as those in the mice (van Buuren and Groothuis-Oudshoorn 2025) package, provides motivation for students to learn base R tools for iteration and custom functions.
By this point, students have set up a collaborative environment with GitHub for their project work and practice using that tool with each other. We then move to programming in R with a focus on functions and iteration to automate and generalize data wrangling processes when applicable. These programming skills enable students to learn about and implement APIs, web scraping, and databases as approaches to acquiring data for their projects.
We pair the presentation of interactive visualization tools from the shiny (Chang et al. 2026) and plotly (Sievert et al. 2026) packages with a podcast featuring Cole Nussbaumer Knaflic, author of Storytelling with Data: A Data Visualization Guide for Business Professionals (Knaflic 2015), focusing on the advantages and disadvantages of interactive tools over static graphics.
The scaffolding around the project involves a variety of milestones to encourage regular attention and provide many opportunities for students to give and receive feedback for refining both their questions and their data visualizations and narrative.
2.2.3 Assessment of students
We assess student learning through a combination of individual and group work. Individually, students complete low-stakes checkpoint quizzes before class based on assigned readings and weekly technical homework challenges on course topics to build skills and deepen their conceptual understanding, which we then formally assess in three in-person concept quizzes.
We designed these quizzes to motivate students to internalize computational concepts and syntax patterns while developing critical thinking skills rather than relying on external support (e.g., Generative AI tools). In groups, students are expected to make individual Git commits to project milestones and the final digital artifact.
To cap off the course, students present their final digital artifact to their classmates in a poster session environment. Groups present a brief summary of their data narrative using the digital artifact as their main visual, refining their verbal communication by repeating their presentation multiple times as small audience groups rotate through the session.
We utilize a non-traditional grading structure; however, we place higher weight on concept quizzes and the final presentation than on assignments completed entirely outside of class.
2.2.4 Instructor & student reflections
We have taught this course every semester since Fall 2023, continuously refining the curriculum. Students view this as a challenging course that touches on many useful topics. One student noted:
“I learned a lot of specific data science tools, like wrangling and iteration techniques, but also a lot of things that I think I’ll use in life even if I don’t go into data science as a career. Understanding URLs, how to access information on the internet, and make meaningful visualizations is a useful tool as a human and I really enjoyed learning about it. This class also made me grow as a student.”
We have ordered topics so that the first part serves as a review and expansion of concepts from DS1, as students recognize that their understanding of visualization and wrangling deepens alongside their understanding of programming. One student commented:
“I felt a huge spike in my learning after we had covered more of the coding basics and I really think that I could’ve understood more of how to do visualizations or wrangling if I had that knowledge.”
Beyond serving as a bridge to upper-level courses, this course offers a vital first opportunity for students to explicitly integrate their foundational knowledge across statistics, computer science, and data science. In one homework challenge, for instance, students use iteration and functions to process and clean hundreds of thousands of JSON files to facilitate a statistical exploration of art objects at the Minneapolis Institute of Art.
Students particularly appreciated the structure of course activities and assignments, citing that these resources facilitated active group learning in the classroom and review outside of it. One student reflected:
“I liked the checkpoints and the class activities, as they helped me understand the concepts through interactive work and reading. The projects helped us put our learning to use with our own topics and datasets.”
Generally, students felt that the course-long project experience facilitated good practices in terms of early idea generation, forming connections with teammates, and making incremental progress. They enjoyed the chance to pursue topics of personal interest and felt the project allowed them to practice the core ideas of the course in a complex, applied setting.
2.3 A course that focuses on data science tools, interactive visualization, and text mining
We created STAT 5910: Intermediate Data Science at Villanova University6 due to strong demand from students for a follow-up course to Introduction to Data Science (DS1 / STAT 4380) and to better prepare them for industry careers after graduation. We identified the content for the course through a mix of discussions with students, alumni, data science practitioners, and academic peers, including the co-authors of this paper. Because our department already offers a course on data mining and predictive analytics (STAT 4480), we omitted modeling content from this curriculum.
We first taught the course in Fall 2023 as a special topics course and offered it for a second time in Spring 2026. It is housed within the Department of Mathematics and Statistics, where a Bachelor of Science in Statistics was first established in 2020. At Villanova, Data Science (or Analytics) is also taught within the Department of Computing Sciences, the College of Engineering, and the Business School.
2.3.1 Learning goals
Students completing STAT 5910 at Villanova will be able to:
- Understand the societal role and demand for modern data science
- Communicate analytical results effectively to both technical and non-technical audiences
- Discuss and implement robust, literate coding practices
- Utilize version control workflows through Git and GitHub
- Interact with SQL databases directly through R
- Extract and parse data from diverse formats and external web sources
- Evaluate Large Language Models (LLMs) and refine prompt engineering strategies
- Apply Gestalt principles of data visualization to improve graphical design choices
- Understand concepts behind dimension reduction and feature engineering
- Construct dynamic, interactive visualizations using DT (Xie et al. 2025), plotly (Sievert et al. 2026), and leaflet (Cheng et al. 2025)
- Build interactive web dashboards using shiny (Chang et al. 2026)
- Develop string processing techniques and apply text mining methods, including term frequencies, TF-IDF, and sentiment analysis
2.3.2 Content & Structure
In service of these learning goals, content of the course focuses on data visualization, text mining, version control with Git/GitHub, SQL database integration, and practical LLM workflows.
Because Quarto was released after many of these students had completed Intro to Data Science, we also integrated an introduction to Quarto into the first iteration of the course.
Class periods involve a mixture of instructor live-coding, dedicated in-class coding time for students, and student presentations. For most topics, we provide a brief review of prerequisite material from DS1 before engaging with new content. Students run R and RStudio locally on their individual machines, and we host all course materials on a password-protected course website.
2.3.3 Assessment of students
We assess student learning through class participation (10%), four mini-projects (50%), and a final project (40%). We assign optional homework exercises throughout the semester to encourage practice, though these are not formally graded.
The four mini-projects focus on key practical skills:
- Interactive Data Visualization: Students analyze the World Happiness Data and produce interactive tables with DT (Xie et al. 2025) and interactive figures with plotly (Sievert et al. 2026).
- Text Mining: Students utilize the harrypotter (Jimenez Rico 2020) package to identify the most popular Hogwarts house based on word frequency, track mentions of “Voldemort” (accounting for “he-who-must-not-be-named”), calculate TF-IDF metrics across books to find unique vocabulary, and run sentiment analyses.
- LLM Evaluation: Students explore early applications of Generative AI. Small groups are assigned different LLMs and tasked with replicating code previously demonstrated in class. Groups then present on model fidelity, hallucination rates, and prompt adjustments required to achieve working code.
- R Tip of the Day (RTD): Designed to expose students to specialized packages and workflow efficiencies. In the first half of the semester, the instructor models these brief presentations (e.g., keyboard shortcuts, the R Graph Gallery, YAML styling, kableExtra (Zhu 2026), ggrepel (Slowikowski 2026)). In the second half, students present their own selected tips on topics such as janitor (Firke 2024), naniar (Tierney et al. 2024), scales (Wickham et al. 2025), ggthemes (Arnold 2026), or custom ggplot2 (Wickham, Chang, et al. 2026) themes.
For the final project, students choose and define a research question and identify appropriate data sources to address it. While we recommend utilizing multiple data sources, it is not strictly required. Students must obtain project topic approval, attend at least one individual consultation meeting with the instructor, and present their work to the class at the end of the semester.
2.3.4 Instructor & student reflections
The Fall 2023 iteration of DS2 comprised 15 students, primarily statistics majors. Based on course evaluations, students identified live in-class coding and dedicated practice time as the most effective elements for their learning. From an instructional perspective, two primary challenges emerged: the significant prep work required to stay ahead of student questions on new tools, and the continuous effort needed to stay current with an evolving technology landscape.
Overall, students responded enthusiastically to tackling complex problems and mastering industry-relevant skills. One student commented:
“The combination of text mining and interactive visualization really opened my eyes to what’s possible with data science. I never thought I could build something like a Shiny dashboard before this class.”
Several students subsequently submitted their course projects to regional and national data visualization competitions, with one student winning our local competition. Others noted that continued exposure to advanced R coding built lasting confidence for real-world tasks. Another student reflected:
“Learning about LLMs and how to use them effectively for coding was incredibly valuable. It’s definitely a skill I’ll use in my career, but now I understand both their potential and limitations.”
2.4 A course that focuses on developing an R package
Since the major in Statistical and Data Sciences (SDS) at Smith College7 was launched in 2016, students have been required to take two courses that focus on computer programming. These requirements were typically fulfilled by the introductory course in programming (CS1, taught in Python) and a follow-up course in data structures (CS2, taught in Java) taught by the Computer Science department. As the number of SDS majors grew, it became increasingly clear that the CS2 course was not serving the needs of SDS majors. The course content did not feel relevant to SDS majors, it did not equip them with the skills they needed, and was an uphill struggle for them given the unfamiliar programming language. The computer science department was also not happy with the arrangement, since the SDS majors were crowding out potential computer science majors in a course that was designed to be a gateway.
We created SDS 270 (and later SDS 271) as a way for SDS majors to fulfill their programming depth requirement within the SDS curriculum. Given the history, it was clear that SDS 270 needed to function more like a computer science class. It should focus on computational thinking and universal programming concepts (e.g., object-oriented programming) that students might see in CS2, but in a language and orientation applicable to data science (e.g., R or Python). Unlike other SDS courses, it should not focus on data analysis, given that its role in the SDS curriculum is to deepen programming skills.
Thus, SDS 270 at Smith College has a clear outcome for all students: to build a usable R package that is hosted on GitHub. Taking inspiration from Reinhart and Genovese (2020), course content during the first half of the semester covers roughly the first half of the material presented by Wickham (2019), which deepens students’ understanding of how R works. Unlike in the first course in data science, where the emphasis is on rapid development of coding skills, in this second course students learn about computer science concepts like object types, S3 classes and methods, and environments. During the second half of the semester, students work in groups to develop an original R package, following advice provided by Wickham and Bryan (2023). All completed packages must pass an R CMD check via GitHub Actions.
Students use modern software development workflows, including the extensive use of Git/GitHub throughout the semester. While students are introduced to GitHub in our DS1, this course prepares students for the mission-critical collaborative work they will see in the senior capstone course.
2.4.1 Learning goals
Students completing SDS 270 will be able to:
- Contribute to an open-source software project using version control
- Write a robust, encapsulated software package in the R programming language
- Write and debug sophisticated functions in R
Unlike all other courses in the statistics and data science curriculum, this course does not explicitly require students to perform data analysis, data wrangling, or data visualization. Instead, students are forced to grapple with the limitations of their understanding of how R actually works, and to build mental models that will help them with more advanced projects in R, and undoubtedly other programming languages.
2.4.2 Content & Structure
SDS 270 is divided into two parts. In the first half of the course, students work through roughly the first half of the material presented by Wickham (2019). For most students, it’s the first time that they are asked to approach R as a programming language in a manner similar to how a computer scientist (and not a data analyst) might. Early emphasis is on a careful examination of object types and coercion rules. This is followed by a treatment of object-oriented programming using the S3 system. This material builds crucial understanding of generic functions and method dispatch that some students will develop further in the process of writing their R package. Improving students’ ability to write robust, well-documented functions, and how to iterate them over a vector (or list) of values is another goal (and one perhaps most germane to data science). Conditional execution, error handling, and environments are also discussed.
In the second half of the course, students work in groups to develop a viable R package on GitHub, following advice given by Wickham and Bryan (2023). While all students must submit a package proposal and have it approved by the instructor, students are largely free to use their creativity to explore the space of possibilities. As such, these packages run the gamut from those that are more focused on a specific data source (or API), to those like ggRtsy (Diaz et al. 2025) that, for example, provide ggplot2 (Wickham, Chang, et al. 2026) color palettes based on the works of the Dutch master Vincent Van Gogh. Each semester, one or two packages are submitted and accepted to CRAN, despite that goal being beyond the scope of the course.
2.4.3 Assessment of students
We assess students in SDS 270 using a variety of common methods: reading quizzes, homework assignments, and in-class labs. Since the course is organized so specifically around the creation of an R package, that assignment provides the clearest insight into student capabilities and accordingly carries heavy weight in grading. We use rubrics to assess the final projects, and assessment also integrates automated feedback tools (e.g., R CMD check, styler (Müller et al. 2025)) alongside continuous integration workflows via GitHub Actions.
2.4.4 Instructor & student reflections
While many of the packages that students create are relatively simple, a few have continued to lead lives of their own beyond the classroom. One notable package is nwslR (Dror 2026), which provides tools for working with data from the National Women’s Soccer League. Two students created the package in the first version of the course in Fall 2019. While both students have gone on to successful careers in data science, one (Arielle Dror ’20) became the Director of Data & Analytics for Bay FC, in no small part due to the interest and technical capacity she demonstrated in creating the package.
Two themes appear most commonly in student reflections about SDS 270. The first is a profound sense of accomplishment in mastering R’s internals. Students often report that despite succeeding in DS1, they now realize how shallow their initial understanding of R actually was, expressing gratitude for the opportunity to deepen it. The second is the realization that R is a “real programming language.” Students connect object-oriented concepts (e.g., classes and methods) learned in computer science to R and apply them in context, yielding a deeper appreciation for R and reinforcing their ability to program in any high-level language.
One student reflected:
“I learned to use R like a developer rather than a user. I learned about the inner workings of R when creating both my function and my package. I also feel a lot more comfortable using GitHub (and understanding it) than I did at the beginning of this course. One of the major things I learned was to think about what I’m seeing in R as how it is interpreted in R, rather than what I as the user am seeing. For example the class and structure of an objects, and how that changes how it behaved. This is the difference between what I perceive as a user versus how R internally processes and interprets the object. I never thought about that distinction before this class, but when developing a functions and a package I needed to consider how R processes and interprets objects. I think this is what has been the most meaningful to me and what I will remember about this class 5 years from now, as I continue programming.”
2.5 A course that focuses on developing a Python package
SDS 271 at Smith College is a recent addition to the curriculum designed to offer an alternative way to fulfill the programming depth requirement for the SDS major using Python. The prerequisites and curriculum position match SDS 270, though the learning goals and content naturally differ. Because our introductory data science course (DS1) is taught in R and introductory computer science (CS1) is taught in Python, students enter well prepared for either path. However, while SDS 270 pivots toward developing computer science concepts in R, SDS 271 provides a space in the curriculum for students to deepen their data wrangling and visualization skills in Python.
SDS 271 covers the core computational skills and tools needed to process, analyze, and visualize data in Python. Topics include functional and object-oriented programming in Python, data wrangling in NumPy (Harris et al. 2020) and Pandas (The pandas development team 2020; McKinney 2010), visualization in Matplotlib (Hunter 2007) and seaborn (Waskom 2021), and statistical analysis with SciPy (Virtanen et al. 2020). The ultimate deliverable is a functional Python package hosted on GitHub. Students learn to debug, test, and document their code while practicing collaborative version control workflows.
Course material draws heavily from McKinney (2022) as well as VanderPlas (2022).
2.5.1 Learning goals
Students completing SDS 271 will be able to:
- Run Python efficiently in Jupyter notebooks and from the command line
- Master core Python syntax, including data types, operators, control statements, and loops
- Interpret error messages and debug code efficiently
- Write and deploy custom functions in Python
- Apply object-oriented programming concepts in Python, including defining custom classes
- Utilize NumPy (Harris et al. 2020) and Pandas (The pandas development team 2020) to wrangle, reshape, and manipulate data sets
- Produce clear and compelling visualizations using Matplotlib (Hunter 2007) and seaborn (Waskom 2021)
- Perform basic curve fitting and statistical analysis in Python
- Collaborate effectively in software development using Git and GitHub
- Write clean code documentation and informative error handling
- Build a complete, unit-tested, and well-documented Python package
2.5.2 Content & Structure
SDS 271 begins with a review of foundational concepts in Python: data types, arithmetic, operators, conditionals, and loops. We then cover writing and calling functions, including the use of keyword and positional arguments, as well as writing docstrings and informative error handling.
Next, we introduce NumPy (Harris et al. 2020) for numerical computing, focusing on file ingestion and array operations (e.g., indexing, slicing, masking, and vector arithmetic). We then transition to Pandas (The pandas development team 2020) to perform structured data manipulation in data frames.
We teach students to visualize data with Matplotlib (Hunter 2007) and seaborn (Waskom 2021), introducing diverse plotting styles while emphasizing clarity and design accuracy.
Students then fit linear models, polynomials, and custom functions using NumPy and SciPy (Virtanen et al. 2020), evaluating goodness-of-fit metrics. They explore random number generation in NumPy to draw from probability distributions, compute p-values, and conduct Monte Carlo simulations.
The course then advances to object-oriented programming, covering class creation with custom attributes and methods. Students work in groups to design a user-friendly Python package incorporating these classes. Teams propose their package concepts to the instructor for feasibility feedback. Collaboration is managed via Git/GitHub, and final packages must be fully documented and thoroughly unit-tested.
In the first half of the course, students work primarily in Jupyter notebooks; when building their packages, they transition to the command line. They learn package directory layout, execution of unit tests via pytest (Krekel et al. 2004), and terminal-based Git workflows involving feature branches and pull requests.
2.5.3 Assessment of students
We assess students in SDS 271 through homework assignments, two major projects, in-class presentations, and oral exams (Theobold 2021).
The midterm project focuses on data wrangling and visualization, while the final project entails creating a complete Python package. Both are team projects accompanied by short presentations: the first focuses on effective graphical design, while the second provides a live technical demonstration of the finished Python package.
We also conduct two fifteen-minute oral exams (midterm and final). In these one-on-one sessions, students work in a Jupyter notebook on the instructor’s machine to execute basic Python operations and explain code previously submitted in homework assignments. Students justify their architectural choices and predict how modifications to specific lines would alter code execution.
2.5.4 Instructor & student reflections
Many students expressed surprise at how much technical progress they made over the semester, highlighting excitement at building complete Python packages from scratch. Students reported significant confidence gains in Python relative to their baseline after introductory computer science. Several noted that working on their final projects was so engaging that they intended to maintain and expand their packages independently after the course concluded.
3 Methods
3.1 Course selection
At the 2023 Joint Statistics Meetings, one of us convened a Birds of a Feather discussion through the ASA Section on Statistics and Data Science Education to share ideas and examples of second courses in data science. This discussion led to the organization of a session at the 2024 Joint Statistical Meetings titled: “Is There a ‘Common Core’ for a Data Science 2 Course?”. These five case studies are drawn from this session and thus are a sample of convenience; therefore, we do not assert that this small sample represents the population of DS2 courses, which continues to grow. These five courses are taught at private higher education institutions in the United States with undergraduate populations between 2000 and 7000 students. While we cannot make inferences to the wider population of institutions worldwide, these case studies serve as a spark for discussion and development of future data science courses.
3.2 Learning outcomes
To facilitate the comparison of the five courses, we analyzed the content of our DS2 courses by cataloging a superset of learning outcomes, and the extent to which our courses cover them. First, we each recorded a list of learning outcomes from our individual courses. At this point we were very specific about outcomes (e.g. “join, merge, or combine data sets”, “identify the class of an object”), so that each course had dozens of listed outcomes. Second, we combined our individual lists into a single list of 181 distinct learning outcomes. These learning outcomes range in technicality and specificity from “iterate on a data storytelling product by reflecting on feedback” to “fork a repo”. For each learning outcome, we determined the extent to which the topic is covered by each of our courses. We used the coding system described in Beckman et al. (2021) and reproduced in Table 2 to indicate how essential various learning outcomes are to each course.
For example, students in DS2 courses at St. Olaf, Macalester, and Villanova are assessed in their ability to “match patterns in strings with regular expressions”, and so those schools code this learning outcome as a 4.
3.3 Data Science Program Topics (MASDER)
To contextualize our analysis in the broader data science curriculum, we leveraged the efforts of the Motivational Attitudes in Statistics and Data Science Education Research (MASDER) team (MASDER Team 2024), who collected course inventories from over 50 institutions and summarized them into data science program topics, subtopics, and competency/concepts for the broader Data Science curriculum (Posner et al. 2024).
We mapped each of our 181 learning outcomes to a competency/concept from the MASDER project, so that some MADSER competencies/concepts are mapped to several learning outcomes, while others may be mapped to no learning outcomes. Note that each competency/concept in MADSER is situated within one of 21 subtopics, and each subtopic is situated within one of 9 overarching topics for data science programs. This tree-based structure helps situate the DS2 topics we teach within the larger framework of the data science curriculum.
3.4 Analysis
For each of the 181 learning outcomes, we calculated the number and proportion of courses among our five that expect the student to demonstrate the learning outcome independently (assessed or not assessed) which is a 3 or 4 in the coding system. Learning outcomes that are covered in most or all of the courses provide a sense of shared emphasis. Learning outcomes that are covered in 1 or 2 of the courses provide a sense of variation in emphasis.
Additionally, we aggregated the coding system at the MASDER topic, subtopic, and competency/concept levels by the count and proportion of the five courses that have at least one learning outcome within that category at a 3 or 4 in the coding system. This provides a summary of consensus and variation of coverage of MASDER competencies/concepts at a variety of levels of tree-based aggregation.
Lastly, we highlight MASDER competencies/concepts that are not covered in the five courses.
4 Results
4.1 Competencies/concepts with shared emphasis
Across the five courses we have described, the greatest shared emphasis was across MASDER topics Data Science Skills, Computational Foundations, Data Processing, and Data Visualization.
Table 3 shows that all of the five courses covered the MASDER topics of Data Science Skills, Computational Foundations, Data, and Data Processing. Data Science Skills received the heaviest emphasis and the broadest coverage, with 71 different learning outcomes identified by the authors falling into this bucket. Of the nine top-level MASDER topics, mathematical foundations received the least emphasis, with only one of the five courses touching upon this topic.
| Topic | Percent of Courses | Number of Learning Outcomes |
|---|---|---|
| Data Science Skills | 100 | 71 |
| Computational Foundations | 100 | 28 |
| Data | 100 | 19 |
| Data Processing | 100 | 8 |
| Data Visualization | 80 | 11 |
| Statistical Foundations | 60 | 6 |
| Modeling Methods | 40 | 18 |
| Modeling Principles | 40 | 16 |
| Mathematical Foundations | 20 | 4 |
Figure 1 combines the top-level information from Table 3 with the third-level of the MASDER tree: competency/concept (represented in the figure by a colored rectangle).
The size (area) of each rectangle is proportional to the number among the five courses that covered a learning outcome mapped to the competency/concept. Note the presence of competencies/concepts like collaboration, workflow, communication, and ethics within the Data Science Skills block. Figure 1 also allows one to contrast the prevalence of Data Science Skills with, say, Modeling Principles. The disparity supports the boundaries we drew in Section 1.2 between DS2 and a course in machine learning or statistical learning, which would place a heavier emphasis on Modeling Principles.
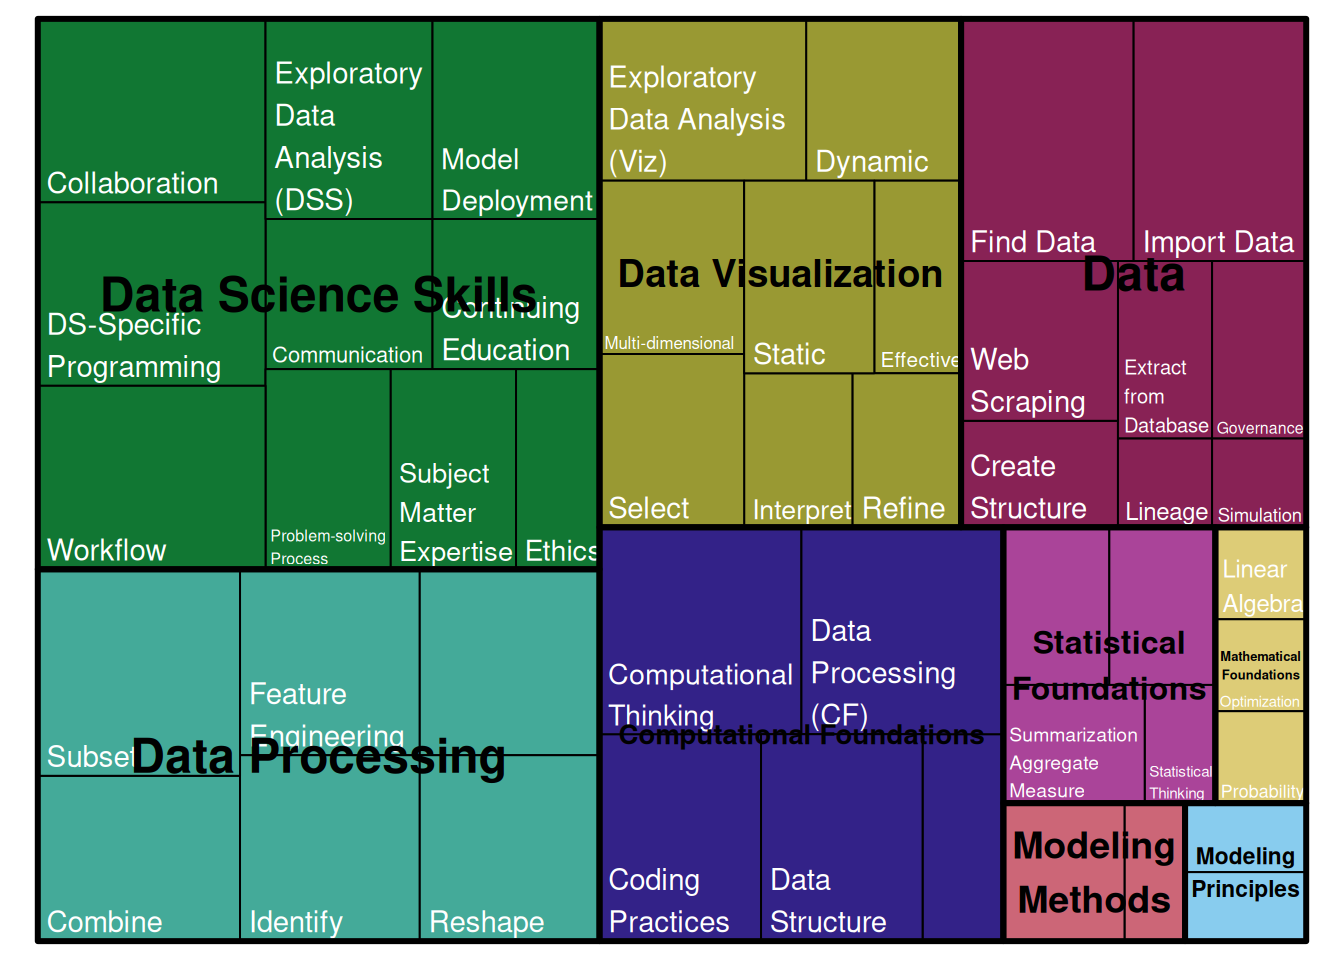
Table 4 summarizes the MASDER competencies/concepts and learning outcomes that received the greatest shared emphasis across our courses. Specifically, Table 4 shows the data science learning outcomes covered at the Student or Assessed level (i.e., a score of 3 or 4, see Table 2) by at least three of our five courses (aggregated at the subtopic level), along with their respective topics, subtopics, and competencies/concepts. While this measurement is not precise, it does reveal the general areas that receive more shared emphasis.
| Sub Topic | Competencies/Concepts | Learning Outcomes |
|---|---|---|
| Computational Foundations | ||
| Knowledge (CF) | Computational Thinking, Data Structure |
|
| Skill (CF) | Coding Practices, Data Processing (CF) |
|
| Data | ||
| Acquisition | Find Data, Import Data, Web Scraping |
|
| Data Processing | ||
| Wrangling | Combine, Feature Engineering, Reshape, Subset |
|
| Cleaning | Fix, Identify |
|
| Data Science Skills | ||
| Method (DSS) | DS-Specific Programming, Workflow |
|
| Professional Tools | Collaboration, Communication, Continuing Education |
|
| Knowledge (DSS) | Exploratory Data Analysis (DSS), Problem-solving Process, Subject Matter Expertise |
|
| Data Visualization | ||
| Create | Dynamic, Exploratory Data Analysis (Viz), Multi-dimensional, Select, Static |
|
Data science-specific programming and workflows (particularly those centered around Git/GitHub) stand out as the competencies/concepts with many learning outcomes that receive a relatively high level of shared emphasis. These learning outcomes involve using standard programming concepts such as control flow, iteration, data structures, and writing and using functions for data science applications. There is also agreement in emphasizing version control in the data science workflow through the use of basic Git/GitHub skills (e.g., commit, push, pull).
Data processing skills (i.e., data wrangling) involving merging, nesting, and subsetting data, writing functions, importing data, or using regular expressions are also noteworthy areas of shared emphasis. Whether students are learning these programming concepts for the first time or learning them in a new programming language, these DS2 courses focus on programming for data processing and analysis. Additionally, these courses raise student expectations when working with complex data structures (e.g., data frames, lists, arrays, and nested structures).
Several data visualization and communication-related learning outcomes receive heavy shared emphasis. These include static choropleth maps or interactive Shiny apps, advanced data processing with strings and regular expressions, and iterating on a data story through feedback.
4.2 Competencies/concepts with variable emphasis
At the same time, we observe the greatest heterogeneity in topic coverage in different aspects of data science skills and data topics, as well as statistical foundations and modeling. Table 5 summarizes the same information as Table 4, but for learning outcomes that were covered to at least level 3 in at most two courses, while also not being covered at all in at least two courses.
| Sub Topic | Competencies/Concepts | Learning Outcomes |
|---|---|---|
| Computational Foundations | ||
| Knowledge (CF) | Data Management, Data Structure |
|
| Skill (CF) | Data Processing (CF), Scalability |
|
| Data | ||
| Stewardship | Governance, Lineage |
|
| Acquisition | Create Structure, Extract from Database, Simulation, Web Scraping |
|
| Data Science Skills | ||
| Method (DSS) | DS-Specific Programming, Model Deployment, Workflow |
|
| Knowledge (DSS) | Ethics |
|
| Professional Tools | Communication |
|
| Data Visualization | ||
| Create | Dynamic, Static |
|
| Modeling Methods | ||
| Unsupervised | Text Analysis |
|
| Statistical Foundations | ||
| Knowledge (SF) | Statistical Thinking |
|
The variance in topic coverage stems from the diversity of end products, overall goals, prerequisites, and other offerings at the institution. The Smith courses frame some of their learning outcomes around creating a package, while St. Olaf, Macalester, and Villanova focus more on communicating understanding from analyzing a potentially non-standard dataset. Understanding text as data holds an important role in St. Olaf and Villanova’s class. Conversely, while all courses use Git/GitHub to some extent, more advanced Git/GitHub tasks (e.g. forks, branches, pull requests) and skills and concepts needed for package development (Model Deployment) are only found in the Smith courses.
In Table 5, we see data science-specific programming and data processing concepts that are more advanced than those in Table 4. For example, many of the items in Table 5 refer to concepts like variable scoping, function environments and methods, and code deployment that are more relevant in a software development context than a typical treatment of data wrangling. Similarly, Table 5 also reveals Git/GitHub concepts (e.g., GitHub Actions) that are more advanced than the beginner push/pull workflow. This is possible if students have previous exposure to programming concepts through a prerequisite course.
Lastly, most of our institutions touch on the concepts in Table 5 in a separate course such as data visualization, statistical modeling, data structures, or object-oriented programming.
Overall, the depth of programming skills developed (e.g., iteration, object-oriented programming) among courses depends importantly on the end-of-semester deliverable and what is needed to complete that project.
4.3 Omitted competencies
In terms of the topical tree structure of Posner et al. (2024), our courses contain little to no coverage of the topics shown in Table 6. As noted earlier, mathematical foundations (e.g., calculus, linear algebra, and probability) and statistical modeling principles are covered elsewhere in the curriculum (in a sequence of mathematics courses, and in a statistical modeling and/or machine learning course, respectively). These omitted topics largely accord with our previous discussion of what our DS2 courses are not (see Section 1.2).
| Sub Topic | Competencies/Concepts | Learning Outcomes |
|---|---|---|
| Data | ||
| Stewardship | Security |
|
| Mathematical Foundations | ||
| Knowledge (MF) | Calculus |
|
| Modeling Methods | ||
| Classification | Algorithmic, Logistic Regression |
|
| Modeling Principles | ||
| Diagnostics | Consistency, Crossvalidation, Precision / Accuracy |
|
| Structure | Hierarchical, Uncorrelated |
|
| Tuning | Bagging, Boosting, Bias-Variance Trade-Off, Model Packaging |
|
We are somewhat dismayed to note that data stewardship was also a largely omitted topic. We affirm that ideas surrounding data privacy, security, governance, licensing, and lineage are important, and while some of these notions arise during our various student project experiences and perhaps we are selling ourselves short in this department, it is nonetheless revealing that those topics appear in Table 6. Given that aspects of data stewardship and data provenance are now included in guidelines for data and computing in pre-university education (National Academies of Sciences, Engineering, and Medicine 2026), more work is needed to make these important topics more transparent for students. Adding content about how to scrape websites ethically, (e.g., respecting robots.txt) or how to store API keys securely in a shared GitHub repository, could easily augment existing components of our courses.
4.4 MASDER tree coverage
Figure 2 illustrates how the coverage of content within our courses maps over a portion of the MASDER data science topic tree. In Figure 2, the top-level topics of Data Science Skills and Mathematical Foundations are expanded. It is easy to see the denser coverage of topics within the Data Science Skills subtree relative to the Mathematical Foundations subtree. We note, in particular, that the Calculus leaf receives no coverage across our DS2 courses.
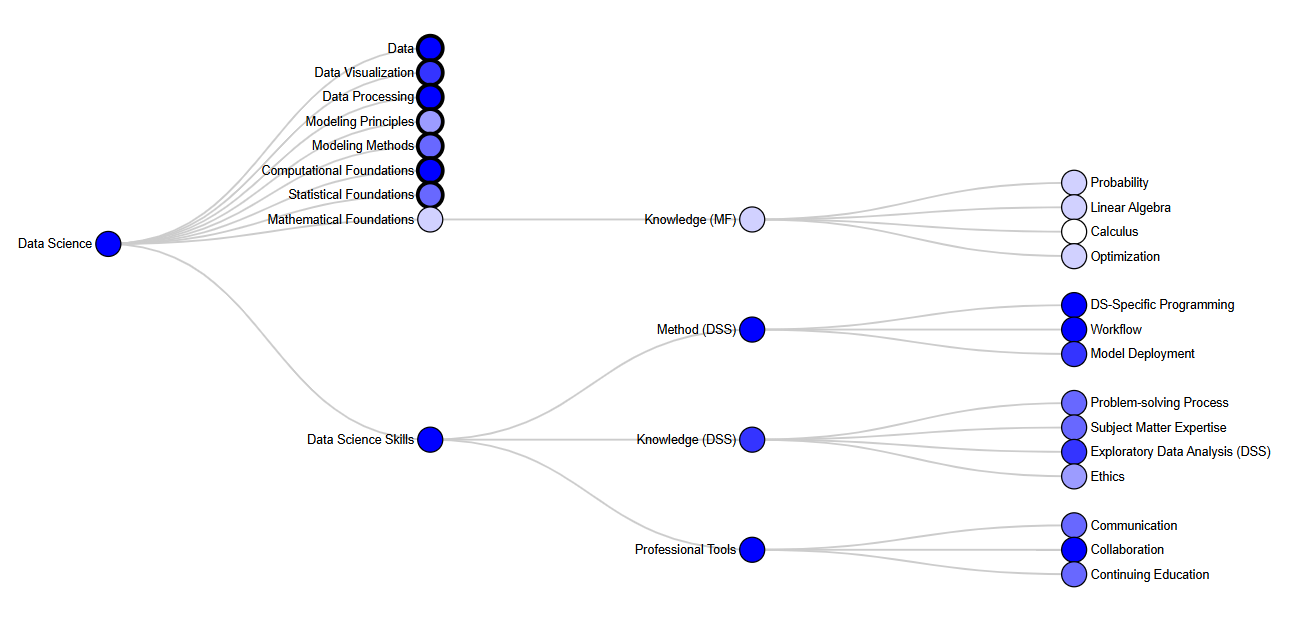
An interactive version of Figure 2 is shown in Figure 3 in our supplementary online materials.
5 Conclusion
5.1 Discussion
Over a decade and a half ago, Nolan and Temple Lang (2010) articulated a vision for more computing in statistics (and data science) curricula. Their three key components that should be integrated into statistics and data science curricula include:
- “broaden statistical computing” (e.g., data wrangling, acquisition, visualization, and alternative formats such as text);
- “deepen computational reasoning and literacy” (e.g., programming concepts, algorithms, functions, debugging, and data structures); and,
- “compute with data in practice of statistics” (e.g., problem solving with real data and alternative approaches to statistical thinking).
We see the DS2 courses described in this paper as manifestations of Nolan and Temple Lang’s vision, where the common themes described in Section 4 are well-captured by their three components of computing. Component 1 includes the DS1 prerequisites for most of the five courses, as well as expansions into more advanced data visualizations and alternative data formats. Component 2 includes writing functions for data acquisition and processing, more advanced data structures, and good coding practices. Component 3 includes communicating a story about data the students have gathered and cleaned, and also managing workflow using version control software.
Starting with this shared canvas, the five courses in this paper then paint their own pictures. From developing packages to diving deeper into GitHub to acquiring data using SQL to telling stories through text analysis, these examples show that DS2 courses can be customized to students’ backgrounds, instructor passions, and program-wide curricula.
5.2 Relationships to other visions for DS2
Bodwin et al. (2025) provide ideas and materials for instructors “interested in teaching a second R course or beyond”. They suggest the following areas for inclusion in an intermediate R course:
“Data types and sources beyond comma-separated files, advanced and dynamic data visualization, complexities of unclean or unstructured data, speed and efficiency concerns for large or repeated analyses, and reproducible workflow for long-term collaborative projects.”
Like many of our common competencies from Section 4.1, Bodwin et al. (2025) advocate for building on DS1 competencies like data wrangling and data visualization in ways that are more advanced, more computationally challenging, and hopefully more realistic to real-world projects.
De Veaux et al. (2017) envisioned a DS2 course that would “help students understand the thinking and structure behind the higher-level functions they experienced in [DS1].” Their learning goals include interacting with many different data types, sources, and interfaces, and building structure from various data forms for analysis. Many of the DS2 courses described in this paper share these objectives with topics such as text as data, regular expressions, SQL, and data acquisition.
However, the De Veaux et al. (2017) vision for DS2 also includes “an introduction to the elementary notions in estimation, prediction, and inference,” in addition to study design and data collection. While some DS2 courses might touch on these topics, the courses described here leave these ideas to other statistics courses in their curricula, choosing instead to focus on literate programming (St. Olaf), data storytelling (Macalester), LLMs and more visualization (Villanova), and developing an R or Python package (Smith). In their own way, each course helps students develop skills on the computational end of the data science spectrum, rather than focus on statistical inference.
De Veaux et al. (2017) acknowledged that the courses they outlined “are clearly bold steps toward a new integrated program in data science,” and expected many iterations. We share the desire for a two-course sequence in data science that will provide solid grounding for upper-level courses, and we offer our courses as potential iterations of the De Veaux et al. (2017) vision that have fit well within our local contexts.
An alternative approach undertaken at Amherst College8 has been to offer a capstone course to cover many of the topics we have described in this paper. STAT 495: Advanced Data Analysis was developed in 2014 to serve as the culminating experience for students in the Statistics major and help them integrate the theoretical and applied knowledge they have acquired throughout their coursework. Within the course, students are exposed to advanced statistical methods and undertake the analysis and interpretation of complex and real-world datasets that go beyond textbook problems. Course topics and structures vary from year-to-year depending on the instructor and selected case studies. While STAT 495 is not a DS2 course per se, it shares some of the same learning goals and topics described in this paper, with two overarching goals: 1) students engage with advanced statistical methods, and 2) students complete multiple project-based data challenges (some group, some individual). While there are many attractive aspects of such a capstone, it cannot fully substitute for an intermediate DS2 course that can provide all students with the deeper data acumen skills they need to thrive in later courses and experiences.
5.3 Limitations
While we have provided five examples of DS2 courses that work at four specific institutions, we acknowledge that the four institutions represent a convenience sample that is not representative of all undergraduate institutions worldwide. Specifically, the four institutions here are, for the most part, small U.S. liberal arts colleges serving mainly residential undergraduate students. We are fortunate to teach to smaller classes (20-40 students) where we are able to get to know our students personally and help them work through technology or conceptual issues. Because we have some flexibility to develop new courses and try them with relatively small cohorts of students, our situations provide excellent labs for testing new ideas. By presenting and synthesizing our “lab-tested” ideas here, we hope that data science educators elsewhere can leverage their understanding of their local conditions to adapt our ideas to their environments as they see fit.
We also acknowledge that our DS2 courses will not work in all institutional contexts. Like many courses in the data science curriculum, it may be challenging to adapt versions of our courses to different educational settings – such as a large research university or a two-year college – where educational support resources may vary greatly. As noted in Section 1.1, first courses in data science at some institutions (e.g., University of Virginia) involve little to no programming, because that is the focus of the second course (Wright et al. 2024). Nevertheless, we hope that our courses can motivate other instructors to craft exciting DS2 courses at their institutions, and that those courses will help students achieve learning outcomes that are appropriate for their program. We have collected a set of topics that emerged independently; this list could be considered a first draft of key concepts for a second core course in the emerging discipline of data science.
We hope and expect that this list will change as more and more voices enter the conversation to discuss ideas they have developed and courses they have created. It’s possible that we will learn that producing a “timeless” list of core topics for a quickly-changing field like data science may be a Sisyphean task, but we believe there is value in the thought process and the attempt.
We also hope that future data science instructors and researchers will produce more formal assessment methods to measure the gains of students taking DS2 courses. Currently, we rely primarily on anecdotal evidence to assess the success of early versions of our courses.
Finally, we acknowledge the disruption that generative AI might cause to our core learning outcomes. Several recent papers (Ellis and Slade 2023; DeLuca et al. 2025) address the pressures of teaching students computing and programming concepts in the presence of tools like generative AI. While we believe that generative AI has already changed some of the ways that students work, it won’t change the value of their fundamental knowledge of computing with data. After graduating, our students will still have to understand how code works, why it isn’t working as desired, and how it can be fixed. In addition, they will have to be able to tell the stories that emerge from data and use insights gained to make important decisions.
5.4 Future work
If we are able to form a consensus as a discipline about key foundational ideas that every data science student should internalize in their early coursework, then we can develop course materials that will enable undergraduate instructors in many settings to teach effectively, regardless of their background. De Veaux et al. (2017) suggested that “resources for faculty including notes, examples, case studies, and—perhaps most importantly—new textbooks will be essential” for the effectiveness of a two-course sequence as the foundation of a data science curriculum. We also agree with De Veaux et al. (2017) that a common core sequence combined with “interactions [with two-year colleges and high schools] will be crucial in order to coordinate courses and instruction to facilitate transfer to four-year institutions.”
We note that most of the courses described here were developed after the introductory and final courses in our data science sequences had already been developed. As such, the topics and learning goals that have emerged as common themes across these courses provide clarity on core skills and topics that fill gaps in understanding between first and final courses in data science sequences. While particular topics or applications may vary, they are chosen with a specific set of learning outcomes in mind. Some of the courses in this paper represent a “grab bag of topics” chosen to customize the learning experience for students while establishing a fixed knowledge base. This stands in contrast to data science curricula that are organized as a “grab bag of courses,” which provide little core data science-specific material that can be counted on across (and often even within) institutions.
We can start by encouraging instructors developing their own DS2 courses to make their materials publicly available as much as possible. Then, as many others jump in to experiment, modify, and add their voices to the conversation, we can grow as a community toward the development of a common core in data science, while still allowing great flexibility and creative freedom in designing student experiences. At the end of the day, we hope that the courses described in this paper can serve as early, but hopefully important, steps toward a core sequence for data science undergraduate students that emerges as the discipline itself matures.
References
Arnold, Jeffrey B. 2026. Ggthemes: Extra Themes, Scales and Geoms for Ggplot2. https://jrnold.github.io/ggthemes/.
Baumer, Benjamin S. 2015. “A Data Science Course for Undergraduates: Thinking with Data.” The American Statistician 69 (4): 334–42. https://doi.org/10.1080/00031305.2015.1081105.
Baumer, Benjamin S., and Nicholas J. Horton. 2023. “Data Science Transfer Pathways from Associate’s to Bachelor’s Programs.” Harvard Data Science Review 5 (1). https://doi.org/10.1162/99608f92.e2720e81.
Baumer, Benjamin S., Daniel T. Kaplan, and Nicholas J. Horton. 2021. Modern Data Science with R. 2nd ed. Chapman and Hall/CRC Press. https://www.routledge.com/Modern-Data-Science-with-R/Baumer-Kaplan-Horton/p/book/9780367191498.
Beckman, Matthew D, Mine Çetinkaya-Rundel, Nicholas J Horton, Colin W Rundel, Adam J Sullivan, and Maria Tackett. 2021. “Implementing Version Control with Git and GitHub as a Learning Objective in Statistics and Data Science Courses.” Journal of Statistics and Data Science Education 29 (sup1): S132–44. https://doi.org/10.1080/10691898.2020.1848485.
Bishop, Christopher M, and Nasser M Nasrabadi. 2006. Pattern Recognition and Machine Learning. Vol. 4. Springer.
Blair, Jean RS, Lawrence Jones, Paul Leidig, Scott Murray, Rajendra K Raj, and Carol J Romanowski. 2021. “Establishing ABET Accreditation Criteria for Data Science.” Proceedings of the 52nd ACM Technical Symposium on Computer Science Education, 535–40. https://doi.org/10.1145/3408877.3432445.
Bodwin, Kelly, Tyson Barrett, and Allison Theobold. 2025. Teaching Intermediate R. United States Conference on Teaching Statistics. https://atheobold.github.io/uscots-intermediate-r/.
Brunner, Robert J, and Edward J Kim. 2016. “Teaching Data Science.” Procedia Computer Science 80: 1947–56. https://doi.org/10.1016/j.procs.2016.05.513.
Cannon, Ann R, George W Cobb, Bradley A Hartlaub, et al. 2019. STAT2: Building Models for a World of Data. 2nd ed. W.H. Freeman.
Carver, Robert, Michelle Everson, John Gabrosek, et al. 2016. Guidelines for Assessment and Instruction in Statistics Education (GAISE) College Report 2016. American Statistical Association; AMSTAT. https://www.amstat.org/asa/files/pdfs/GAISE/GaiseCollege_Full.pdf.
CC2020 Task Force. 2020. Computing Curricula 2020: Paradigms for Global Computing Education. Association for Computing Machinery. https://doi.org/10.1145/3467967.
Çetinkaya-Rundel, Mine, and Victoria Ellison. 2021. “A Fresh Look at Introductory Data Science.” Journal of Statistics and Data Science Education 29 (sup1): S16–26. https://doi.org/10.1080/10691898.2020.1804497.
Chang, Winston, Joe Cheng, JJ Allaire, et al. 2026. Shiny: Web Application Framework for r. https://shiny.posit.co/.
Cheng, Joe, Barret Schloerke, Bhaskar Karambelkar, Yihui Xie, and Garrick Aden-Buie. 2025. Leaflet: Create Interactive Web Maps with the JavaScript Leaflet Library. https://rstudio.github.io/leaflet/.
Cobb, George W. 1998. Introduction to Design and Analysis of Experiments. John Wiley & Sons.
Danyluk, Andrea, and Paul Leidig. 2021. Computing Competencies for Undergraduate Data Science Curricula: ACM Data Science Task Force. Association for Computing Machinery. https://doi.org/10.1145/3453538.
De Veaux, Richard D., Mahesh Agarwal, Maia Averett, et al. 2017. “Curriculum Guidelines for Undergraduate Programs in Data Science.” Annual Review of Statistics and Its Application 4 (1): 1–16. https://doi.org/10.1146/annurev-statistics-060116-053930.
DeLuca, Laura S, Alex Reinhart, Gordon Weinberg, Michael Laudenbach, Sydney Miller, and David West Brown. 2025. “Developing Students’ Statistical Expertise Through Writing in the Age of AI.” Journal of Statistics and Data Science Education, 1–13. https://doi.org/10.1080/26939169.2025.2497547.
Diaz, Katelyn, Silas Weden, and Tess Goldmann. 2025. ggRtsy: Add Some van Gogh Colors and Overlay Colors on Your Ggplot().
Donoho, David. 2017. “50 Years of Data Science.” Journal of Computational and Graphical Statistics 26 (4): 745–66. https://doi.org/10.1080/10618600.2017.1384734.
Dror, Arielle. 2026. nwslR: Compiles Dataset for the National Women’s Soccer League (NWSL). https://github.com/nwslR/nwslR.
Ellis, Amanda R, and Emily Slade. 2023. “A New Era of Learning: Considerations for ChatGPT as a Tool to Enhance Statistics and Data Science Education.” Journal of Statistics and Data Science Education 31 (2): 128–33. https://doi.org/10.1080/26939169.2023.2223609.
Firke, Sam. 2024. Janitor: Simple Tools for Examining and Cleaning Dirty Data. https://github.com/sfirke/janitor.
Hardin, J., R. Hoerl, N. J. Horton, et al. 2015. “Data Science in Statistics Curricula: Preparing Students to ’Think with Data’.” The American Statistician 69 (4): 343–53. https://doi.org/10.1080/00031305.2015.1077729.
Harris, Charles R., K. Jarrod Millman, Stéfan J. van der Walt, et al. 2020. “Array Programming with NumPy.” Nature 585 (7825): 357–62. https://doi.org/10.1038/s41586-020-2649-2.
Hicks, Stephanie C, and Rafael A Irizarry. 2018. “A Guide to Teaching Data Science.” The American Statistician 72 (4): 382–91. https://doi.org/10.1080/00031305.2017.1356747.
Hunter, J. D. 2007. “Matplotlib: A 2D Graphics Environment.” Computing in Science & Engineering 9 (3): 90–95. https://doi.org/10.1109/MCSE.2007.55.
Irizarry, Rafael A. 2019. Introduction to Data Science: Data Analysis and Prediction Algorithms with R. Chapman and Hall/CRC Press. https://doi.org/10.1201/9780429341830.
Ismay, Chester, and Albert Y Kim. 2019. Statistical Inference via Data Science: A ModernDive into r and the Tidyverse. Chapman; Hall/CRC. https://doi.org/10.1201/9780367409913.
James, Gareth, Daniela Witten, Trevor Hastie, and Robert Tibshirani. 2013. An Introduction to Statistical Learning. Vol. 112. Springer.
Jimenez Rico, Alejandro. 2020. Harrypotter: Palettes Generated from All "Harry Potter" Movies. https://github.com/aljrico/harrypotter.
Knaflic, Cole Nussbaumer. 2015. Storytelling with Data: A Data Visualization Guide for Business Professionals. Wiley.
Knuth, Donald Ervin. 1984. “Literate Programming.” The Computer Journal 27 (2): 97–111. https://doi.org/10.1093/comjnl/27.2.97.
Krekel, Holger, Bruno Oliveira, Ronny Pfannschmidt, Floris Bruynooghe, Brianna Laugher, and Florian Bruhin. 2004. Pytest x.y. Https://github.com/pytest-dev/pytest.
Kuiper, Shonda, and Jeff Sklar. 2012. Practicing Statistics: Guided Investigations for the Second Course. Pearson Higher Ed.
Lasser, Jana, Debsankha Manik, Alexander Silbersdorff, Benjamin Säfken, and Thomas Kneib. 2021. “Introductory Data Science Across Disciplines, Using Python, Case Studies, and Industry Consulting Projects.” Teaching Statistics 43: S190–200. https://doi.org/10.1111/test.12243.
Leidig, Paul, Maureen Doyle, and Christian Servin. 2026. “An Introduction to the Joint Taskforce on Undergraduate Data Science Curriculum.” (New York, NY, USA), SIGCSE TS 2026, 1623–24. https://doi.org/10.1145/3770761.3777132.
MASDER Team. 2024. Motivational Attitudes in Statistics and Data Science Education Research. Https://masder.net/.
McKinney, Wes. 2010. “Data Structures for Statistical Computing in Python.” In Proceedings of the 9th Python in Science Conference, edited by Stéfan van der Walt and Jarrod Millman. https://doi.org/ 10.25080/Majora-92bf1922-00a .
McKinney, Wes. 2022. Python for Data Analysis: Data Wrangling with Pandas, NumPy, and Jupyter. 3rd ed. O’Reilly Media, Inc. https://wesmckinney.com/book.
Müller, Kirill, Lorenz Walthert, and Indrajeet Patil. 2025. Styler: Non-Invasive Pretty Printing of r Code. https://github.com/r-lib/styler.
National Academies of Sciences, Engineering, and Medicine. 2018. Data Science for Undergraduates: Opportunities and Options. National Academies Press. https://nas.org/envisioningds.
National Academies of Sciences, Engineering, and Medicine. 2026. Data and Computing in K–12 Education: Foundational Competencies. Consensus Study Report. The National Academies Press. https://doi.org/10.17226/29303.
Nolan, Deborah, and Duncan Temple Lang. 2010. “Computing in the Statistics Curricula.” The American Statistician 64 (2): 97–107. https://doi.org/10.1198/tast.2010.09132.
Pebesma, Edzer. 2026. Sf: Simple Features for r. https://r-spatial.github.io/sf/.
Posner, Michael A., and April Kerby-Helm. 2025. The Landscape of Introductory Data Science Courses. https://ww2.amstat.org/meetings/jsm/2025/onlineprogram/abstract.cfm?sid=4272&tid=4984.
Posner, Michael A., April Kerby-Helm, Alana Unfried, Douglas Whitaker, Marjorie E. Bond, and Leyla Batakci. 2024. “A Cross-Disciplinary Review of Introductory Undergraduate Data Science Course Content.” Proceedings of the 55th ACM Technical Symposium on Computer Science Education v. 2 (New York, NY, USA), SIGCSE 2024, 1937. https://doi.org/10.1145/3626253.3635352.
Ramsey, Fred, and Daniel Schafer. 2013. The Statistical Sleuth: A Course in Methods of Data Analysis. 3rd ed. Brooks/Cole Publishing Co.
Reinhart, Alex, and Christopher R Genovese. 2020. “Expanding the Scope of Statistical Computing: Training Statisticians to Be Software Engineers.” Journal of Statistics Education, 1–23. https://doi.org/10.1080/10691898.2020.1845109.
Roback, Paul, and Julie Legler. 2021. Beyond Multiple Linear Regression: Applied Generalized Linear Models and Multilevel Models in R. Chapman and Hall/CRC Press. https://doi.org/10.1201/9780429066665.
Scheidegger, Carlos, Gordon Woodhull, Christophe Dervieux, Charles Teague, J. J. Allaire, and Yihui Xie. 2022. Quarto. Posit, PBC. https://quarto.org/.
Schumacher, Carol S., and Martha J. Siegel. 2015. 2015 CUPM Curriculum Guide to Majors in the Mathematical Sciences. The Mathematical Association of America. https://maa.org/wp-content/uploads/2024/06/2015-CUPM-Curriculum-Guide.pdf.
Sheather, Simon. 2009. A Modern Approach to Regression with R. Springer Science & Business Media.
Sievert, Carson, Chris Parmer, Toby Hocking, et al. 2026. Plotly: Create Interactive Web Graphics via Plotly.js. https://plotly-r.com.
Slowikowski, Kamil. 2026. Ggrepel: Automatically Position Non-Overlapping Text Labels with Ggplot2. https://ggrepel.slowkow.com/.
Stodden, Victoria. 2020. “The Data Science Life Cycle: A Disciplined Approach to Advancing Data Science as a Science.” Communications of the ACM 63 (7): 58–66. https://doi.org/10.1145/3360646.
The pandas development team. 2020. Pandas-Dev/Pandas: Pandas. V. latest. Zenodo, released February. https://doi.org/10.5281/zenodo.3509134.
Theobold, Allison S. 2021. “Oral Exams: A More Meaningful Assessment of Students’ Understanding.” Journal of Statistics and Data Science Education 29 (2): 156–59. https://doi.org/10.1080/26939169.2021.1914527.
Tierney, Nicholas, Di Cook, Miles McBain, and Colin Fay. 2024. Naniar: Data Structures, Summaries, and Visualisations for Missing Data. https://github.com/njtierney/naniar.
van Buuren, Stef, and Karin Groothuis-Oudshoorn. 2025. Mice: Multivariate Imputation by Chained Equations. https://github.com/amices/mice.
VanderPlas, Jake. 2022. Python Data Science Handbook: Essential Tools for Working with Data. 2nd ed. O’Reilly Media, Inc.
Virtanen, Pauli, Ralf Gommers, Travis E. Oliphant, et al. 2020. “SciPy 1.0: Fundamental Algorithms for Scientific Computing in Python.” Nature Methods 17: 261–72. https://doi.org/10.1038/s41592-019-0686-2.
Waskom, Michael L. 2021. “Seaborn: Statistical Data Visualization.” Journal of Open Source Software 6 (60): 3021. https://doi.org/10.21105/joss.03021.
Wickham, Hadley. 2023. Tidyverse: Easily Install and Load the Tidyverse. https://tidyverse.tidyverse.org.
Wickham, Hadley, and Jennifer Bryan. 2023. R Packages. 2nd ed. O’Reilly Media, Inc. https://r-pkgs.org/.
Wickham, Hadley, Mine Çetinkaya-Rundel, and Garrett Grolemund. 2023. R for Data Science. 2nd ed. O’Reilly Media, Inc. https://r4ds.had.co.nz/.
Wickham, Hadley, Winston Chang, Lionel Henry, et al. 2026. Ggplot2: Create Elegant Data Visualisations Using the Grammar of Graphics. https://ggplot2.tidyverse.org.
Wickham, Hadley, Romain François, Lionel Henry, Kirill Müller, and Davis Vaughan. 2026. Dplyr: A Grammar of Data Manipulation. https://dplyr.tidyverse.org.
Wickham, Hadley, Thomas Lin Pedersen, and Dana Seidel. 2025. Scales: Scale Functions for Visualization. https://scales.r-lib.org.
Wing, Jeannette M. 2019. “The Data Life Cycle.” Harvard Data Science Review 1 (1): 6. https://doi.org/10.1162/99608f92.e26845b4.
Wright, Brian, Peter Alonzi, and Ali Rivera. 2024. “The Future of Data Science Education.” arXiv Preprint arXiv:2407.11824, ahead of print. https://doi.org/10.48550/arXiv.2407.11824.
Xiao, Ting, Ronald I Greenberg, and Mark V Albert. 2021. “Design and Assessment of a Task-Driven Introductory Data Science Course Taught Concurrently in Multiple Languages: Python, r, and MATLAB.” Proceedings of the 26th ACM Conference on Innovation and Technology in Computer Science Education v. 1, 290–95. https://doi.org/10.1145/3430665.3456364.
Xie, Yihui, Joe Cheng, Xianying Tan, and Garrick Aden-Buie. 2025. DT: A Wrapper of the JavaScript Library DataTables. https://github.com/rstudio/DT.
Yan, Donghui, and Gary E Davis. 2019. “A First Course in Data Science.” Journal of Statistics Education 27 (2): 99–109. https://doi.org/10.1080/10691898.2019.1623136.
Zhu, Hao. 2026. kableExtra: Construct Complex Table with Kable and Pipe Syntax. https://haozhu233.github.io/kableExtra/.
6 Acknowledgments
We thank the editor, associate editor, and several reviewers for detailed and helpful feedback that improved the manuscript. We would also like to thank our colleagues and other thought-partners who helped us develop these courses. We extend our deep gratitude to the many people in the open source community who developed the tools and corresponding documentation that we use these courses.
7 Appendix
7.1 Public course materials
- Data Science 2 at St. Olaf College
- Intermediate Data Science at Macalester College
- Programming for Data Science in R at Smith College
7.2 Online only content (supplementary materials)
Supplementary materials described below are available at https://doi.org/10.7910/DVN/GKXWFN
7.2.1 Full topic list
The full table of learning outcomes and topics covered by course is also available at https://tinyurl.com/4nnpn4m7.
An interactive list is shown in Table 7 of the online version of this paper.
7.2.2 Interactive tree
An interactive version coverage of our courses over the MASDER data science topic tree in shown in Figure 3.
Footnotes
We note that at Macalester and St. Olaf, mathematics, computer science, statistics, and data science are all housed in one department.↩︎
The courses described in this paper came together during a session at the 2024 Joint Statistical Meetings titled: “Is There a ‘Common Core’ for a Data Science 2 Course?”.↩︎
Two of the five courses DS2 we describe are offered at Smith College, and our author group includes a colleague at Amherst College (which does not offer any of our five courses). Thus, while our five courses are offered at four institutions, our author group offers insights from five institutions.↩︎
St. Olaf College is a private liberal arts college in Northfield, Minnesota, known for its strong programs in mathematics and sciences and its commitment to integrative learning.↩︎
Macalester College is a private liberal arts college in Saint Paul, Minnesota, known for its academic excellence, internationalism, multiculturalism, and service to society.↩︎
Villanova University is a medium-sized, comprehensive, Catholic university located outside of Philadelphia, Pennsylvania.↩︎
Smith College is a private liberal arts women’s college in Northampton, Massachusetts, renowned for its rigorous academic programs and pioneering work in interdisciplinary studies.↩︎
Amherst College is a private selective liberal arts college in Amherst, Massachusetts that “prepares our students for fulfilling careers, service to society, and a lifetime of intellectual engagement”.↩︎
Citation
BibTeX citation:
@online{baumer2026,
  author = {Baumer, Benjamin S. and Beltz-Mohrmann, Gillian D. and
    Heggeseth, Brianna C. and Horton, Nicholas J. and Myint, Leslie and
    Posner, Michael A. and Roback, Paul},
  title = {Models for {Second} {Courses} in {Data} {Science:} {Insights}
    from {Five} {Different} {Institutions}},
  date = {2026-10-16},
  langid = {en},
  abstract = {As data science continues to mature as an academic
    discipline, curricular standardization remains elusive. While a
    number of groups have defined program-level learning outcomes for
    data science, there is no consensus surrounding course-level
    learning outcomes. We present five different models for a *second*
    course in data science, each of which comes with its own learning
    goals, coverage of topics, points of emphasis, prerequisites, and
    role in our respective (statistics and) data science curricula. We
    use the data science topic, subtopic, and competency/concept
    framework created by the MASDER project to analyze the content of
    our courses, and present areas of similarity and difference across
    them. While we cannot claim that our list of courses is
    comprehensive, we hope that the material we present will provide
    other institutions and instructors with vetted ideas for second
    courses in data science. We also hope that our analysis can move the
    field towards greater coordination (and perhaps even
    standardization) within the data science curriculum.}
}
For attribution, please cite this work as:
Baumer, Benjamin S., Gillian D. Beltz-Mohrmann, Brianna C. Heggeseth, et
al. 2026. “Models for Second Courses in Data Science: Insights
from Five Different Institutions.” October 16.