ETL for Medium Data
Ben Baumer
A Grammar for Reproducible and Painless Extract-Transform-Load Operations on Medium Data

Benjamin S. Baumer http://bit.ly/2pgFSfJ Dartmouth Biomedical Data Science March 16th, 2018
Four distinct ideas
- A Grammar for
- Reproducible and Painless
- Extract-Transform-Load Operations
- on Medium Data
An example: Citi Bike

- New York City’s municipal bike sharing
- 12,000 bikes, 472 stations
- Problems:
Citi Bike: the rules

Citi Bike: data
We obtained bike usage statistics for April, May, June and July 2014 from Citi Bike’s website (https://www.citibikenyc.com/system-data). This dataset contains start station id, end station id, station latitude, station longitude and trip time for each bike trip. 332 bike stations have one or more originating bike trips. 253 of these are in Manhattan while 79 are in Brooklyn (left panel of Figure 1). We processed this raw data to get the number of bike trips between each station pair during morning rush hours. –Singhvi, et al. (2015)
- Could you reproduce this analysis?
Citi Bike: set up citibike database
library(citibike)

bikes <- etl("citibike",
             dir = "~/dumps/citibike/",
             db = src_mysql_cnf("citibike"))
bikes %>%
  etl_update(years = 2014, months = 4:7)
Citi Bike: query database
trips <- bikes %>%
  tbl("trips")

trips %>%
  group_by(Start_Station_ID) %>%
  summarize(num_trips = n()) %>%
  filter(num_trips >= 1) %>%
  arrange(desc(num_trips)) %>%
  collect()
## # A tibble: 332 x 2
##    Start_Station_ID num_trips
##               <dbl>     <dbl>
##  1             519.    50316.
##  2             521.    49511.
##  3             293.    45391.
##  4             497.    45154.
##  5             426.    40046.
##  6             435.    37542.
##  7             285.    36074.
##  8             499.    33849.
##  9             151.    33776.
## 10             444.    33663.
## # ... with 322 more rows
Citi Bike: reproducibility?
- How confident are you that we have a copy of the same data as these researchers?
- same number of stations…
- same number of rows?
- rows contain the same information?
- impossible to verify given the description
Citi Bike: another example
We focused on the month of September, 2013; i.e. the peak month of the usage in 2013. Therefore, the final sample consists of 237,600 records (330 stations × 24 hours × 30 days). –Fagigh-Imani & Eluru (2016)
bikes %>%
  etl_update(year = 2013, months = 9)
- Now how confident are you?
Citi Bike: a discrepancy
trips %>%
  filter(YEAR(Start_Time) == 2013) %>%
  group_by(Start_Station_ID,
           DAY(Start_Time),
           HOUR(Start_Time)) %>%
  summarize(N = n(),
            num_stations = COUNT(DISTINCT(Start_Station_ID)),
            num_days = COUNT(DISTINCT(DAYOFYEAR(Start_Time)))) %>%
  collect() %>%
  nrow()
## [1] 167258
- Many stations had no trips during certain hours of certain days
- Is that a problem?
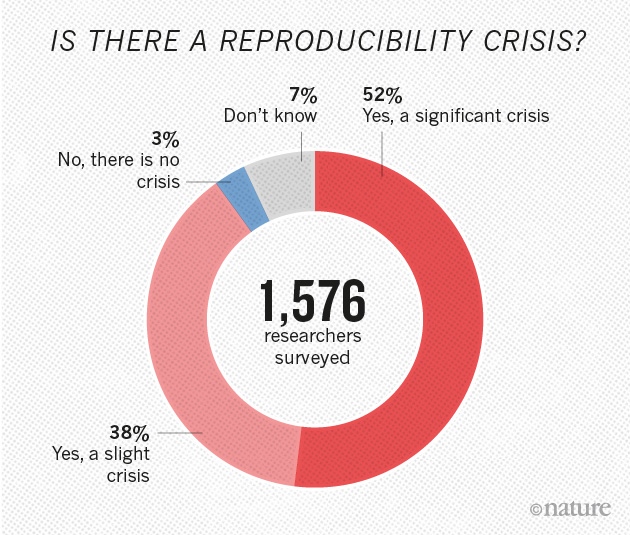
Replicability Crisis
- replicability:
- different people get the same results with different data
- entails data collection
- reproducibility:
- same/different people get the same results with same data
- entails data analysis
Literate Programming
- Don Knuth (1985)
- code and natural language interspersed
- we implement this in R Markdown
Reproducible scholarship
An article about a computational result is advertising, not scholarship. The actual scholarship is the full software environment, code and data, that pro- duced the result. –Claerbout, 1994
Reproducibility in other fields
Data size for a single user


| small |
< several GB |
RAM |
R |
| medium |
several GB – a few TB |
hard disk |
SQL |
| big |
many TB or more |
cluster |
Spark? |
Challenges of medium data - size
- Everything takes a little longer…
- downloading
- wrangling
- querying
- Takes up space on disk
- Too big to work with in memory, but…
- …many (most?) R users don’t know SQL
- …even if they know
SELECT, they probably don’t know CREATE TABLE
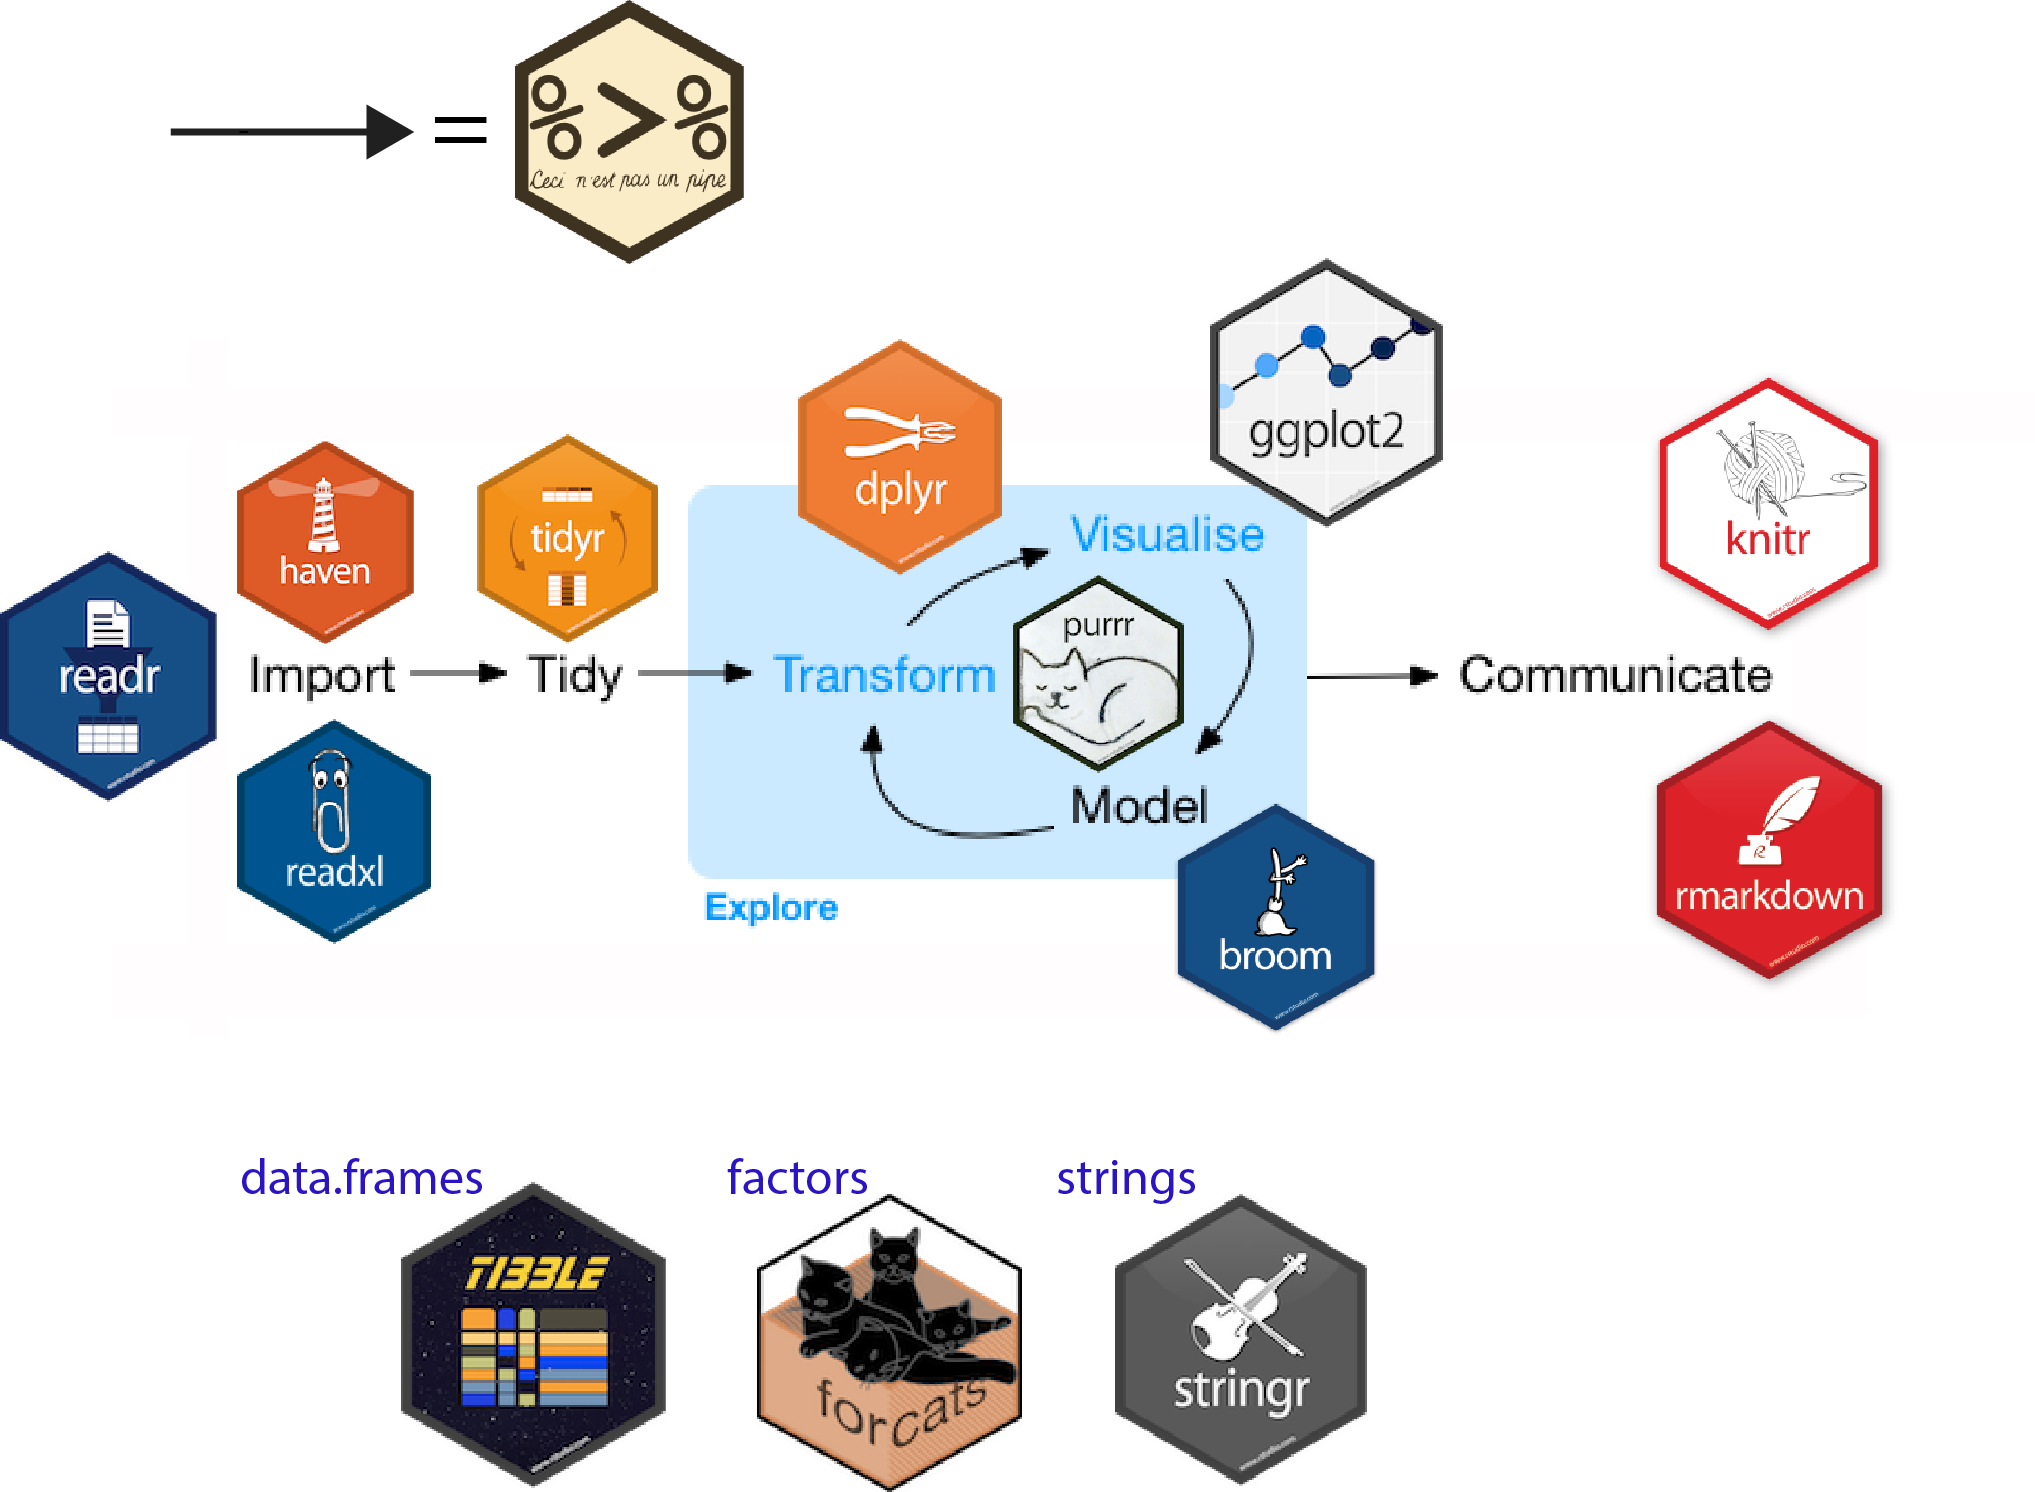
ETL operations

- Extract -> download
- Transform -> wrangle
- Load -> into database (typically SQL)
Challenges of medium data - ETL
Challenges of medium data - workflow
So you want to write a script…
- Portability
- shell scripts may not be cross-platform
- require command line knowledge
- Version Control
- even with
git, may not be robust
- Languages
- best tool for job?
- or too many tools in the toolbox?
- Usability
- likely to have idiosyncratic UI
A grammar?
In linguistics, grammar is the set of structural rules governing the composition of clauses, phrases, and words in any given natural language. –Wikipedia
- The Grammar of Graphics (Wilkinson, 2006)
dplyr: a grammar of data manipulation (Wickham & Francois, 2016)
Big question
- How can we do reproducible research on medium data…
- …when we can’t just re-post the data (legally or technically)?
- …when our scripts aren’t cross-platform?
- …when we don’t speak the same language?
A grammar for ETL
- nouns:
- objects that inherit from class
etl
- verbs:
etl_extract()etl_transform()etl_load()
- adverbs:
- arguments to “verb” functions
- predictable, pipeable syntax

ETL suite of packages
- A CRAN package that provides a framework for ETL
- An ecosystem of dependent packages for other data sources
Example 1: mtcars
library(etl)

cars <- etl("mtcars") %>%
  etl_extract() %>%
  etl_transform() %>%
  etl_load()

cars %>%
  tbl("mtcars") %>%
  group_by(cyl) %>%
  summarize(N = n(), mean_mpg = mean(mpg))
## # Source:   lazy query [?? x 3]
## # Database: sqlite 3.19.3 [/tmp/RtmpW7JK2C/file70c245bf0158.sqlite3]
##     cyl     N mean_mpg
##   <int> <int>    <dbl>
## 1     4    11     26.7
## 2     6     7     19.7
## 3     8    14     15.1
Example 2: airlines
- Create an empty database in MySQL
system("mysql -e 'CREATE DATABASE IF NOT EXISTS airlines;'")
library(airlines)

src_db <- src_mysql_cnf("airlines", groups = "aws")

ontime <- etl("airlines", db = src_db, dir = "~/dumps/airlines")
Example 2: airlines cont’d
ontime %>%
  etl_extract(years = 1987:2017) %>%
  etl_transform(years = 1990:1999) %>%
  etl_load(years = 1996:1997, months = c(1:6, 9))
Example 2: airlines cont’d
- Answer questions
- Which airline has the shortest average delay at BTV?
ontime %>%
  tbl("flights") %>%
  filter(year == 1996, dest == "BTV") %>%
  group_by(carrier) %>%
  summarize(num_flights = n(),
            avg_delay = mean(arr_delay, na.rm = TRUE)) %>%
  arrange(desc(avg_delay))
## # Source:     lazy query [?? x 3]
## # Database:   mysql 5.7.21-0ubuntu0.16.04.1 [bbaumer@127.0.0.1:/airlines]
## # Ordered by: desc(avg_delay)
##   carrier num_flights avg_delay
##   <chr>         <dbl>     <dbl>
## 1 UA             665.     11.2
## 2 US            1254.      9.22
Noun: an etl object is
- a
dplyr::src_sql object
- provides a connection to a SQL database
- local or remote
- SQLite by default (
tempfile)
- MySQL and PostgreSQL also supported
- uses
DBI::dbWriteTable methods
## [1] "etl_mtcars" "etl" "src_dbi" "src_sql" "src"
Noun: an etl object has
- a place to store files
- local storage for raw and processed data
tempdir by default
## files:
##     n      size                              path
## 1 365  6.719 GB  /home/bbaumer/dumps/airlines/raw
## 2 363 19.536 GB /home/bbaumer/dumps/airlines/load
##       Length Class           Mode
## con   1      MySQLConnection S4
## disco 2      -none-          environment
Verbs: chaining operations
getS3method("etl_update", "default")
## function(obj, ...) {
##   obj <- obj %>%
##     etl_extract(...) %>%
##     etl_transform(...) %>%
##     etl_load(...)
##   invisible(obj)
## }
## <environment: namespace:etl>
getS3method("etl_create", "default")
## function(obj, ...) {
##   obj <- obj %>%
##     etl_init(...) %>%
##     etl_update(...) %>%
##     etl_cleanup(...)
##   invisible(obj)
## }
## <environment: namespace:etl>
Common use cases
- Regular updates for updated data
- daily dump of overwritten customer data
- Regular updates for new data
- Asynchronous updates
- recover from network disruption or file corrpution
- Reconfigure and reload
- update database after software update
- Porting a database
- publish local database to remote server
Roll your own!
- Extending
etl vignette
create_etl_package()- Write (at least one of) 3 methods:
etl_extract.foo()etl_transform.foo()etl_load.foo()
- Document, push, etc.

Template: etl_load
etl_load.etl_pkgname <- function(obj, ...) {
  load_dir <- attr(obj, "load_dir")
  # use params in ... to fetch the appropriate files

  # load the CSV(s) into SQL
  DBI::dbWriteTable(obj$con, "mytable", path_to_csv)

  invisible(obj)
}
Other Features
etl_update() chains ETL operationsetl_cleanup() deletes filessmart_download() only downloads files that don’t already exist- helper functions for matching dates in filenames
- Hard-coded SQL schema scripts
- Optimize with keys, indexes, partitions, etc.
The Future
- Write more
etl packages!
- Performance enhancements:
Use :memory: instead of disk for SQLite?- Use
feather for intermediate files?
- Parallelize?
- prefer
dbWriteTable() methods that read CSVs
- avoid disk access