class: center, middle, inverse, title-slide # Intro to Data Science ## Mini-Lecture 1 ### Ben Baumer ### SDS 192</br>Jan 27, 2020</br>(<a href="http://beanumber.github.io/sds192/lectures/01-first_day.html" class="uri">http://beanumber.github.io/sds192/lectures/01-first_day.html</a>) --- class: center, middle, inverse # Data science --- .center[] --- ## v1.0 .center[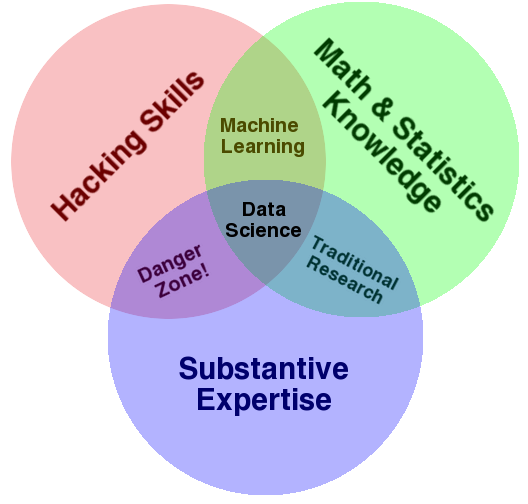] --- ## v2.0 .center[] --- ## v3.0 .center[ 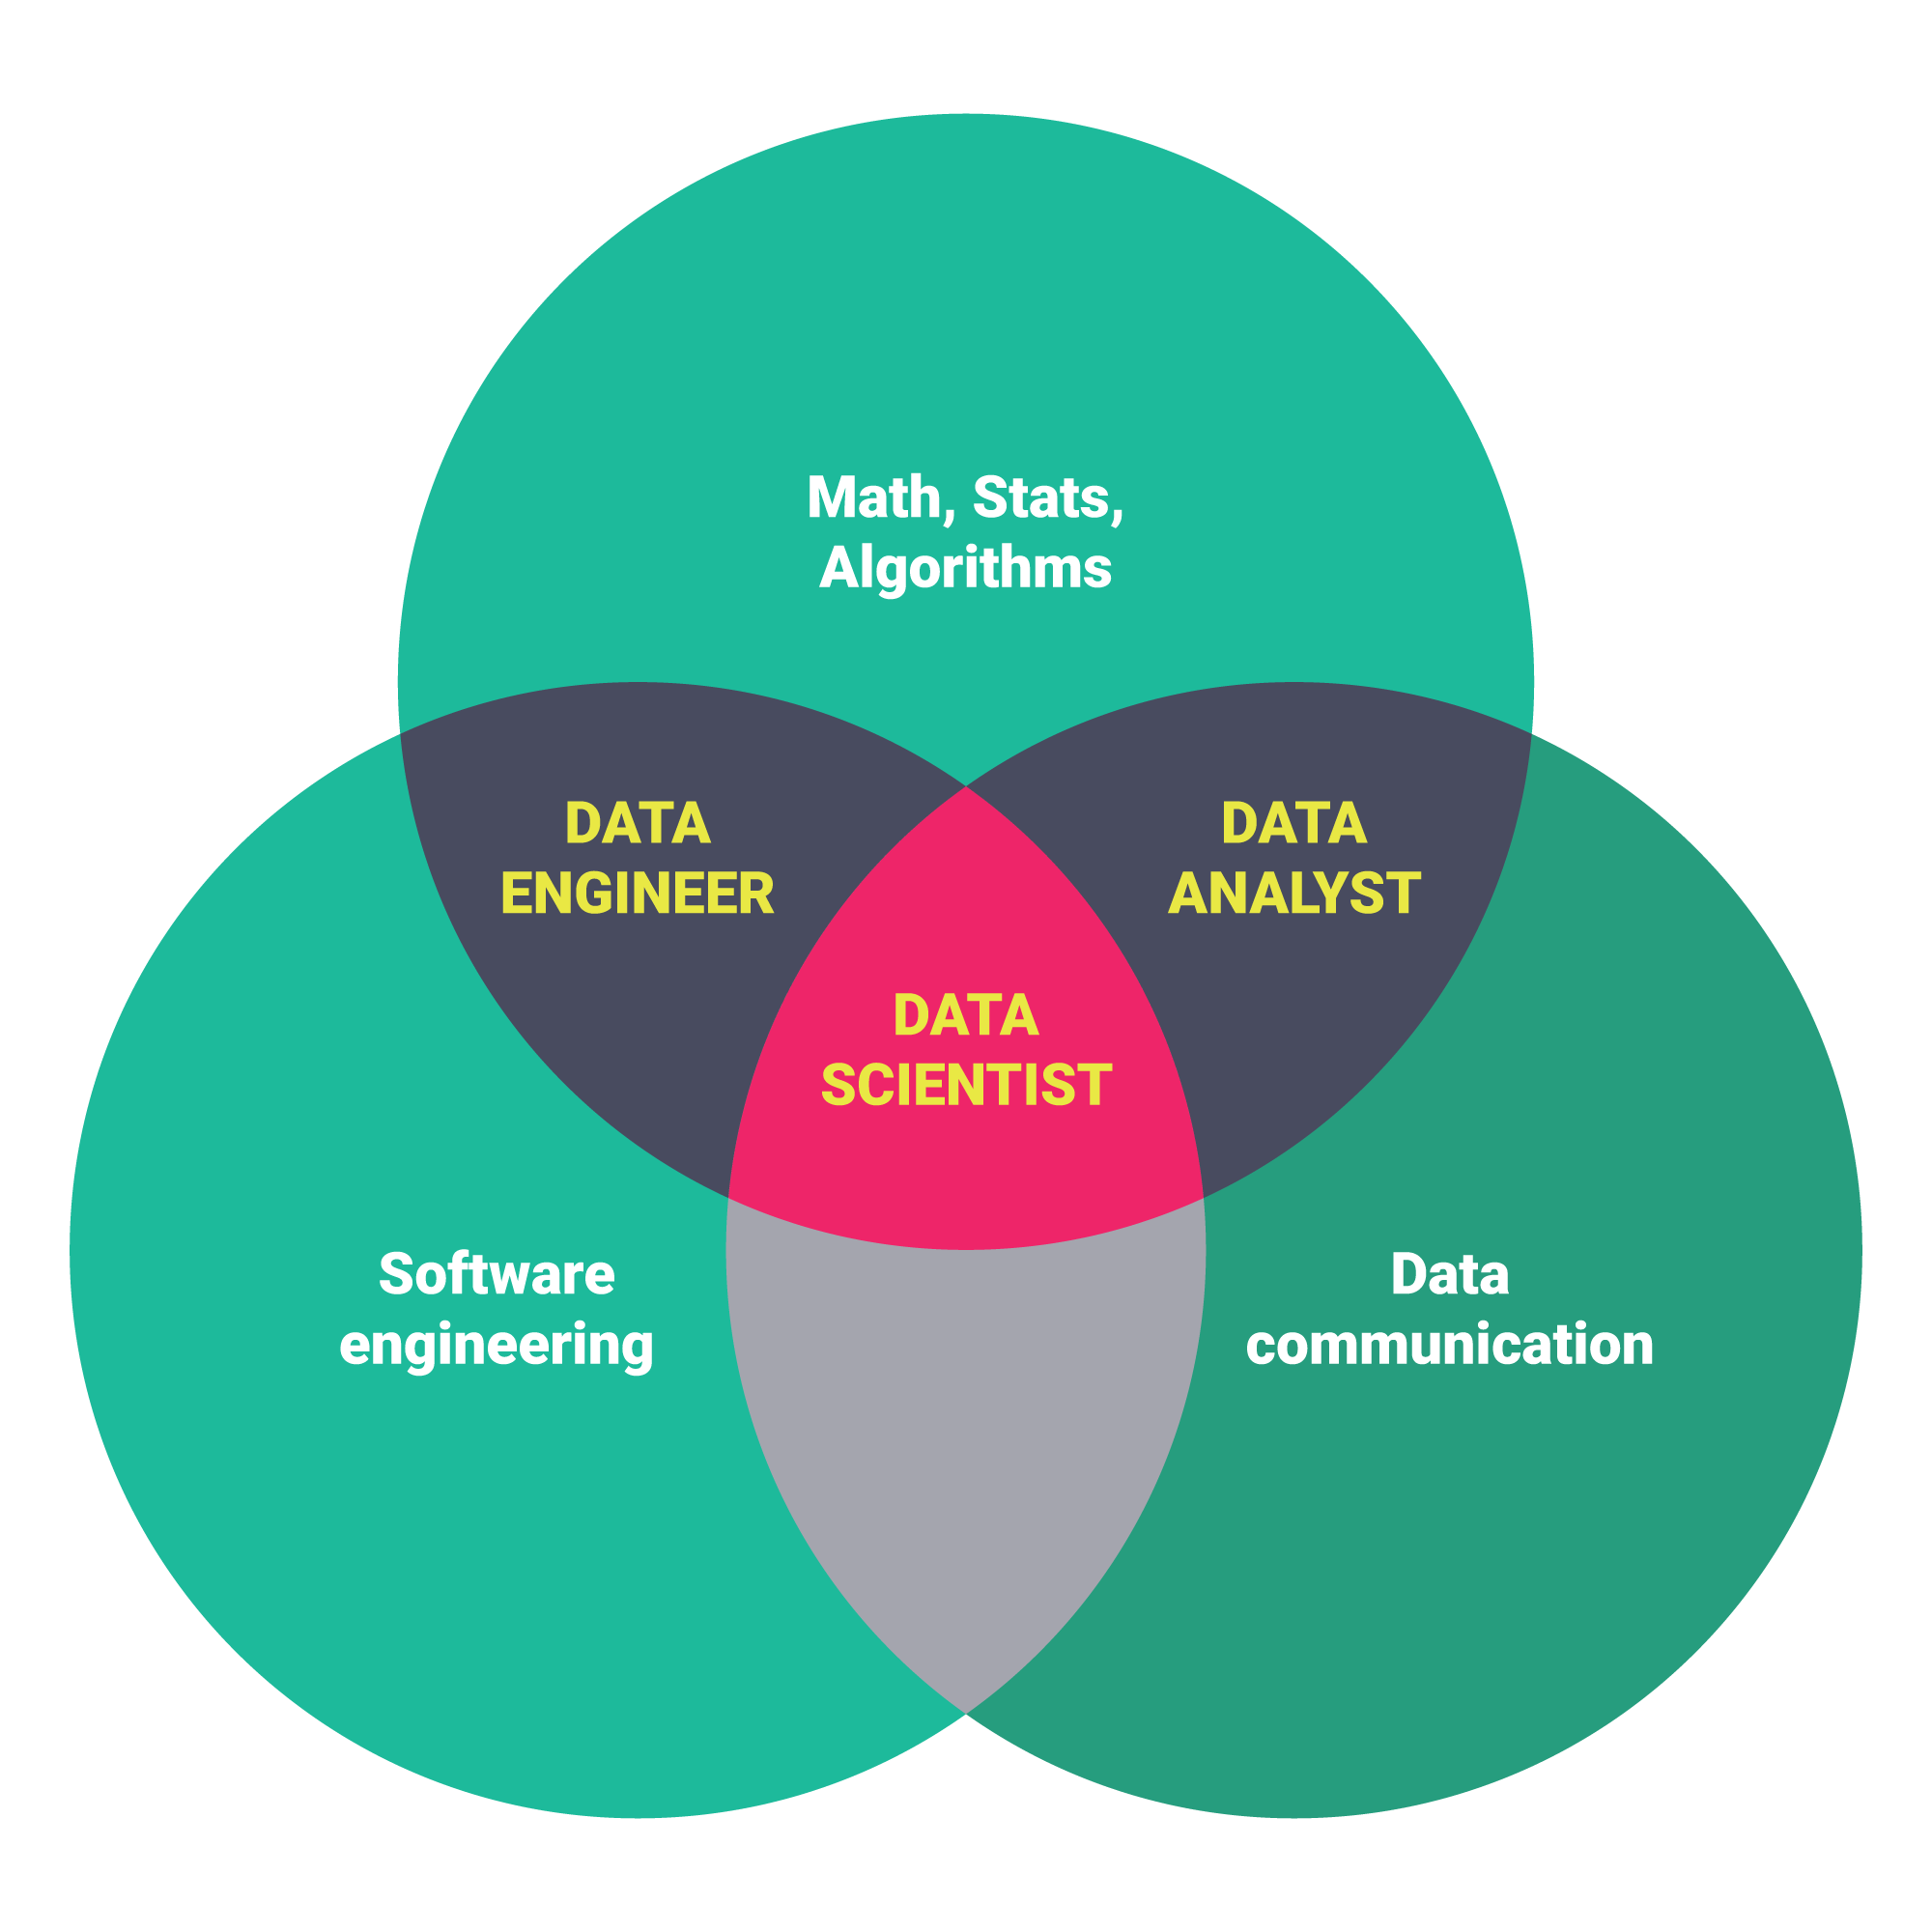] --- ## v4.0? .center[] --- ## Data scientist as poorly-trained statistician <blockquote class="twitter-tweet" data-lang="en"><p lang="en" dir="ltr">Statistician: person using data in [scientifically] rigorous ways. Data Scientist: person writings blog posts, giving talks ... about data.</p>— Dirk Eddelbuettel (@eddelbuettel) <a href="https://twitter.com/eddelbuettel/status/263737821918027776">October 31, 2012</a></blockquote> <script async src="//platform.twitter.com/widgets.js" charset="utf-8"></script> --- ## Data scientist `\(\subset\)` statistician <blockquote class="twitter-tweet" data-lang="en"><p lang="en" dir="ltr"><a href="https://twitter.com/eddelbuettel">@eddelbuettel</a> my cynical definition: a data scientist is a statistician who is useful ;)</p>— Hadley Wickham (@hadleywickham) <a href="https://twitter.com/hadleywickham/status/263750846246969344">October 31, 2012</a></blockquote> <script async src="//platform.twitter.com/widgets.js" charset="utf-8"></script> --- ## Data scientist as intersection <blockquote class="twitter-tweet" data-lang="en"><p lang="en" dir="ltr">Data Scientist (n.): Person who is better at statistics than any software engineer and better at software engineering than any statistician.</p>— Josh Wills (@josh_wills) <a href="https://twitter.com/josh_wills/status/198093512149958656">May 3, 2012</a></blockquote> <script async src="//platform.twitter.com/widgets.js" charset="utf-8"></script> --- class: center, middle, inverse # Case study: Sabermetrics --- ## What is sabermetrics? .pull-left[  ] .pull-right[ - statistics - computing - math - baseball - ~~physics~~ ] --- ## Early 20th century: data .pull-left[ 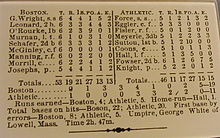 ] .pull-right[ - Boxscores - game level - dozens of rows ] --- ## Early 20th century: tools .pull-left[  ] .pull-right[ - 1880: [punched cards invented](http://en.wikipedia.org/wiki/History_of_computing_hardware) (by IBM) - 1935: punched cards used by SSA ] --- ## Branch Rickey era: data .pull-left[ <img src="http://www.kevinsavagecards.com/ItemImages/000016/39_12308a_lg.jpeg" class="one-col-image"> ] .pull-right[ - Tabulated - recorded by hand (?) - hundreds of rows (?) - 1951: [*Official Encyclopedia of Baseball*](http://www.baseball-reference.com/bullpen/The_Official_Encyclopedia_of_Baseball) - games played - batting average (for hitters) - wins and losses (pitchers) ] --- ## Branch Rickey era: tools .pull-left[ <img src="http://www.vintagecalculators.com/assets/images/autogen/MonroeLN160X_1.jpg" class="one-col-image"> ] .pull-right[ - 1940s: [Monroe LN-160X](http://www.vintagecalculators.com/html/monroe_ln-160x.html) - 1947: [Victor is the world's largest exclusive manufacturer of adding machines](https://en.wikipedia.org/wiki/Victor_Technology) ] --- ## Bill James era: data .pull-left[  ] .pull-right[ - Compiled: - seasonal, some batter vs. pitcher - thousands of rows - 1969: ["Big Mac"](https://fivethirtyeight.com/features/before-baseball-reference-statheads-relied-on-the-big-mac/) ] --- ## Bill James era: tools .pull-left[ - 1973: [TI SR-10](https://en.wikipedia.org/wiki/Calculator#History) pocket calculator - 1974: [Ingres](https://en.wikipedia.org/wiki/Ingres_(database)) - 1977: [Apple II](https://en.wikipedia.org/wiki/Apple_II) - 1981: [MS-DOS](https://en.wikipedia.org/wiki/MS-DOS) first released - 1986: [SQL](https://en.wikipedia.org/wiki/SQL) becomes and ANSI standard ] .pull-right[ <img src="https://upload.wikimedia.org/wikipedia/commons/7/7e/Apple_II_IMG_4212.jpg" class="one-col-image"> ] --- ## Internet era: data - Seasonal - `player-team-season` - 100,000 rows seasonal - 1995: [Sean Lahman](https://en.wikipedia.org/wiki/Sean_Lahman) publishes first online database .center[] --- ## Internet era: tools .pull-left[ - 1990: [Windows 3.0](https://en.wikipedia.org/wiki/Windows_3.0) - 1995: [Excel 7.0](https://en.wikipedia.org/wiki/Microsoft_Excel#Number_of_rows_and_columns) can handle at most 16k rows - 1998: [iMac G3](https://en.wikipedia.org/wiki/IMac_G3) ] .pull-right[ <img src="http://cdn.cultofmac.com/wp-content/uploads/2016/08/tumblr_o860yvcIUg1rnoexwo1_1280-780x439.jpg" class="one-col-image"> ] --- .center[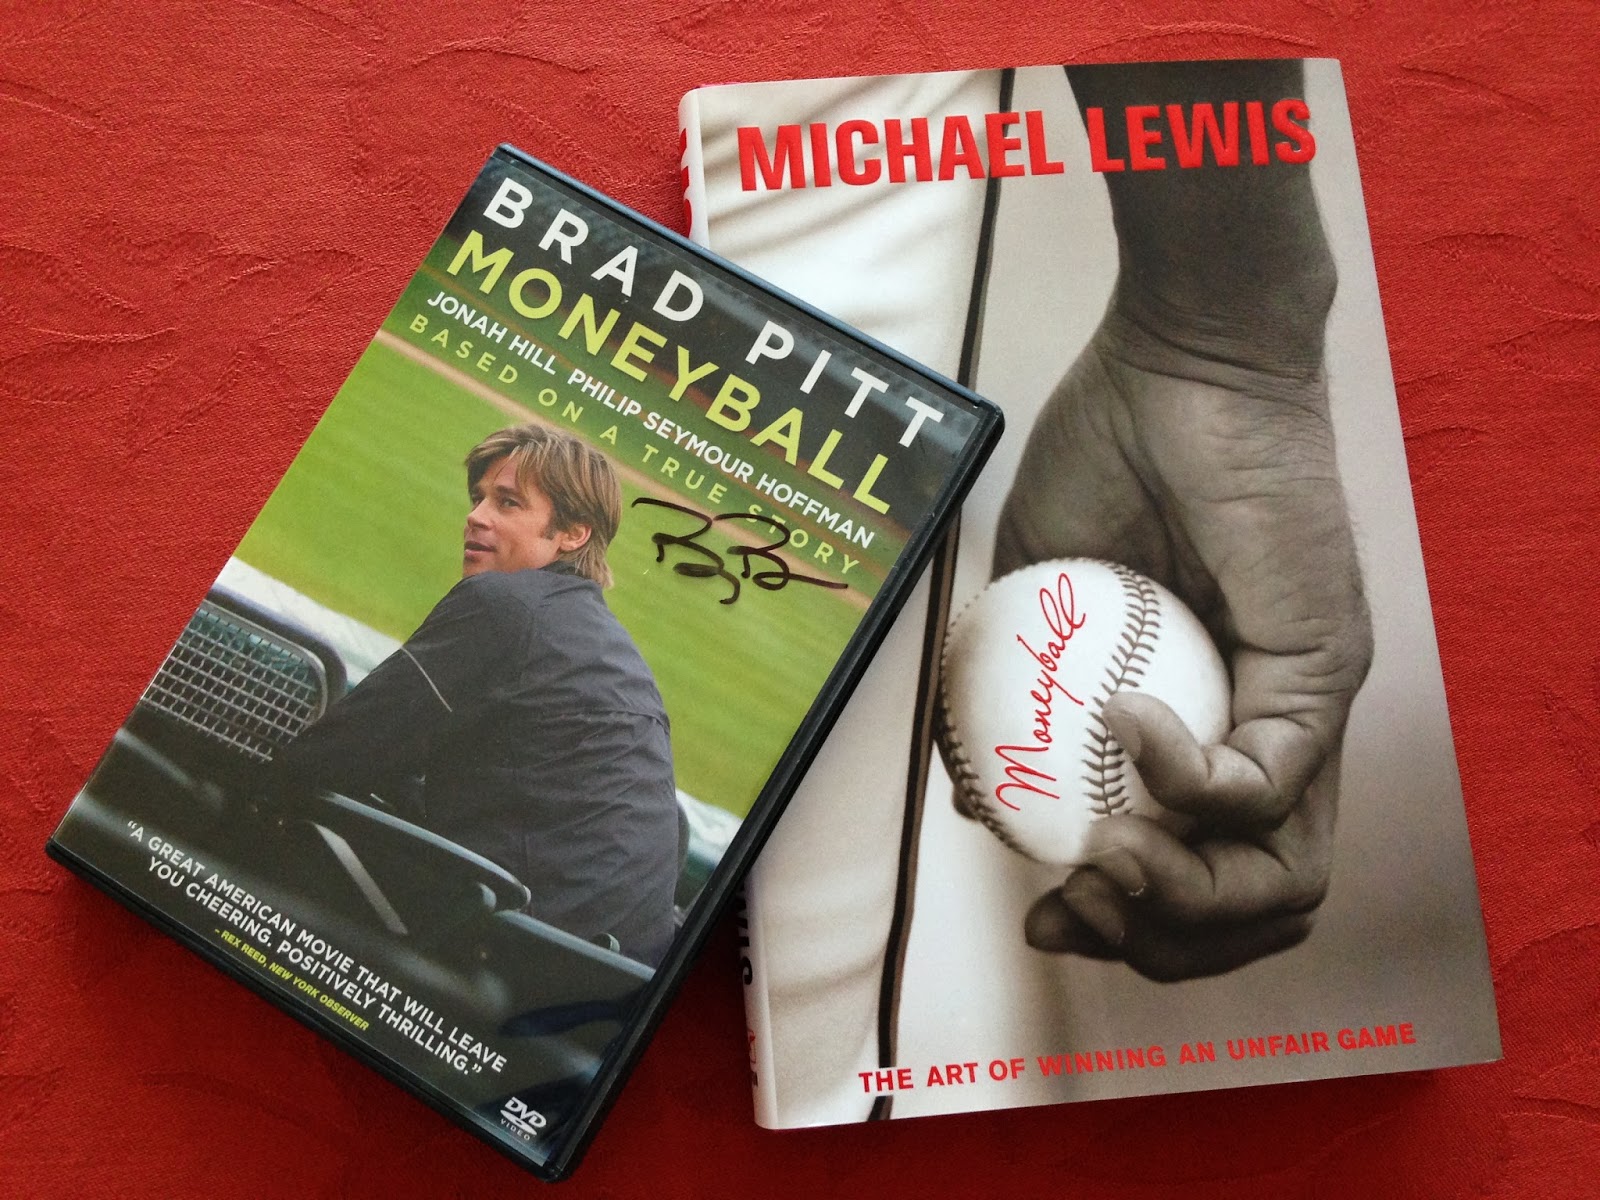] --- ## Moneyball era: data .pull-left[ - Play-by-play - batter vs. pitcher - several million rows - 1996: [Retrosheet](https://en.wikipedia.org/wiki/Retrosheet) starts publishing play-by-play data online ] .pull-right[ <img src="http://www.retrosheet.org/hitloc.jpg" width="450px"> ] --- ## Moneyball era: tools .pull-left[ - 2003: [Excel 11.0](https://en.wikipedia.org/wiki/Microsoft_Excel#Number_of_rows_and_columns) can handle at most 64k rows - 2005: [MySQL](https://en.wikipedia.org/wiki/MySQL) powers Google </br></br> ] .pull-right[ ```bash play,1,0,hendr001,00,X,9/F9S play,1,0,whitd001,22,BBFFC,K/C play,1,0,alomr001,32,BBCFBB,W play,1,0,cartj001,00,X,4/P4 play,1,1,raint001,00,X,43/G34 play,1,1,coraj001,01,CX,4/P4MD play,1,1,thomf001,30,BBBB,W play,1,1,ventr001,00,B,WP.1-2 play,1,1,ventr001,11,B.CB,WP.2-3 play,1,1,ventr001,32,B.CB.SFFBS,K ``` ] --- ## Nate Silver vs. BB .pull-left[  ] .pull-right[ 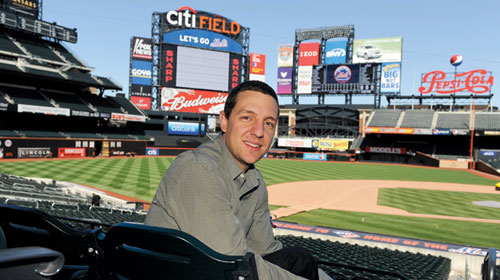 ] --- ## About Me .pull-left[ - Asst. Prof. of SDS - PhD (math), [City U. of New York](http://math.gc.cuny.edu) - Statistical Analyst for [NY Mets](http://www.mets.com) - M.A. (applied math), [UCSD](http://math.ucsd.edu) - B.A. (econ), [Wesleyan](http://www.wesleyan.edu) - ...I'm a townie ([NHS](http://www.northamptonschools.org/project/northampton-high-school/) '96) ] .pull-right[ <img src="https://pbs.twimg.com/profile_images/891771981623963648/SRvHaYAv.jpg" class="one-col-image"> ] --- ## PITCHf/x era: data .pull-left[ - Pitch-by-pitch - each pitch - several million rows *per season* ] .pull-right[ <img src="http://cpsievert.github.io/slides/pitchRx/CC/gameday.png" class="one-col-image"> ] --- ## PITCHf/x era: tools .pull-left[ <img src="http://upload.wikimedia.org/wikipedia/en/thumb/6/62/MySQL.svg/1200px-MySQL.svg.png" class="one-col-image"> ] .pull-right[ - 2000s: SQL can handle tens of millions of rows on modest hardware - 2007: [Excel 12.0](https://en.wikipedia.org/wiki/Microsoft_Excel#Number_of_rows_and_columns) can handle at most 1M rows ] --- ## Statcast era: data .pull-left[ - 2015: [Statcast](https://en.wikipedia.org/wiki/Statcast) deployed - Player-tracking - every 1/15th of a second - several million rows *per game* ] .pull-right[ <img src="http://baseball.physics.illinois.edu/images/Tracking-2.png" class="one-col-image"> ] --- ## Statcast era: tools .pull-left[ - Hadoop - Apache Spark - [Cray supercomputer](http://www.cray.com/blog/crays-mystery-mlb-team-revealed/)! ] .pull-right[ <img src="http://www.extremetech.com/wp-content/uploads/2016/06/products_xc_40_photo_01.jpg" width="450px"> ] --- ## Summary | data | rows | tool | method | result | |:-----------------:|:-----:|:-----:|:------:|:----:| | boxscores | dozens | paper | arithmetic | rates | | tabulated | hundreds | adding machine | arithmetic | formulas | | compiled | thousands | calculator | algebra | metrics | | seasonal | 100 k | spreadsheet | regression | metrics | | play-by-play | 1 M | SQL (laptop) | regression | fitted models | | pitch-by-pitch | 10 M | SQL (server) | mixed, Bayesian | statistical models | | player tracking | billions | Spark | ML | ? | --- class: center, middle, inverse # Data scientists --- ## What skills do you need? .pull-left[ - programming with data - (R or Python) and SQL - see CSC 111 for Python - statistical modeling - SDS 220 + SDS 291 + SDS 293 - domain knowledge - communication - SDS 109, 235, or 236 ] .pull-right[ <img src="http://s-media-cache-ak0.pinimg.com/originals/a1/1f/9b/a11f9ba7d5499ba31ef5b2959c96bae6.png" class="one-col-image"> ] --- ## Data science jobs <blockquote class="twitter-tweet" data-lang="en"><p lang="en" dir="ltr">Talk about in-demand: 2.7 Million New Data & Analytics Job Openings Every Year by 2020, via @IBMhttp://ow.ly/zx9p30bxfxi <a href="https://t.co/RzZAmVTYdx">pic.twitter.com/RzZAmVTYdx</a></p>— This is Statistics (@ThisisStats) <a href="https://twitter.com/ThisisStats/status/861975385956921344">May 9, 2017</a></blockquote> <script async src="http://platform.twitter.com/widgets.js" charset="utf-8"></script> --- ## [Hilary Parker](https://hilaryparker.com/about-hilary-parker/) .pull-left[  ] .pull-right[ - Data Scientist at [Stitch Fix](https://www.stitchfix.com/) - co-host, [Not So Standard Deviations](https://soundcloud.com/nssd-podcast) - 2013: PhD in biostatistics, JHU - 2008: BA, Pomona, math, molecular biology ] --- ## [Emily Robinson](https://robinsones.github.io/about/) .pull-left[ - Data Scientist at DataCamp - formerly Data Analyst at Etsy - 2016: MS, organizational behavior, INSEAD - 2014: BA, decision sciences, Rice ] .pull-right[  ] --- ## [Dannia Guzman '15](https://www.linkedin.com/in/danniaguzman/) .pull-left[ 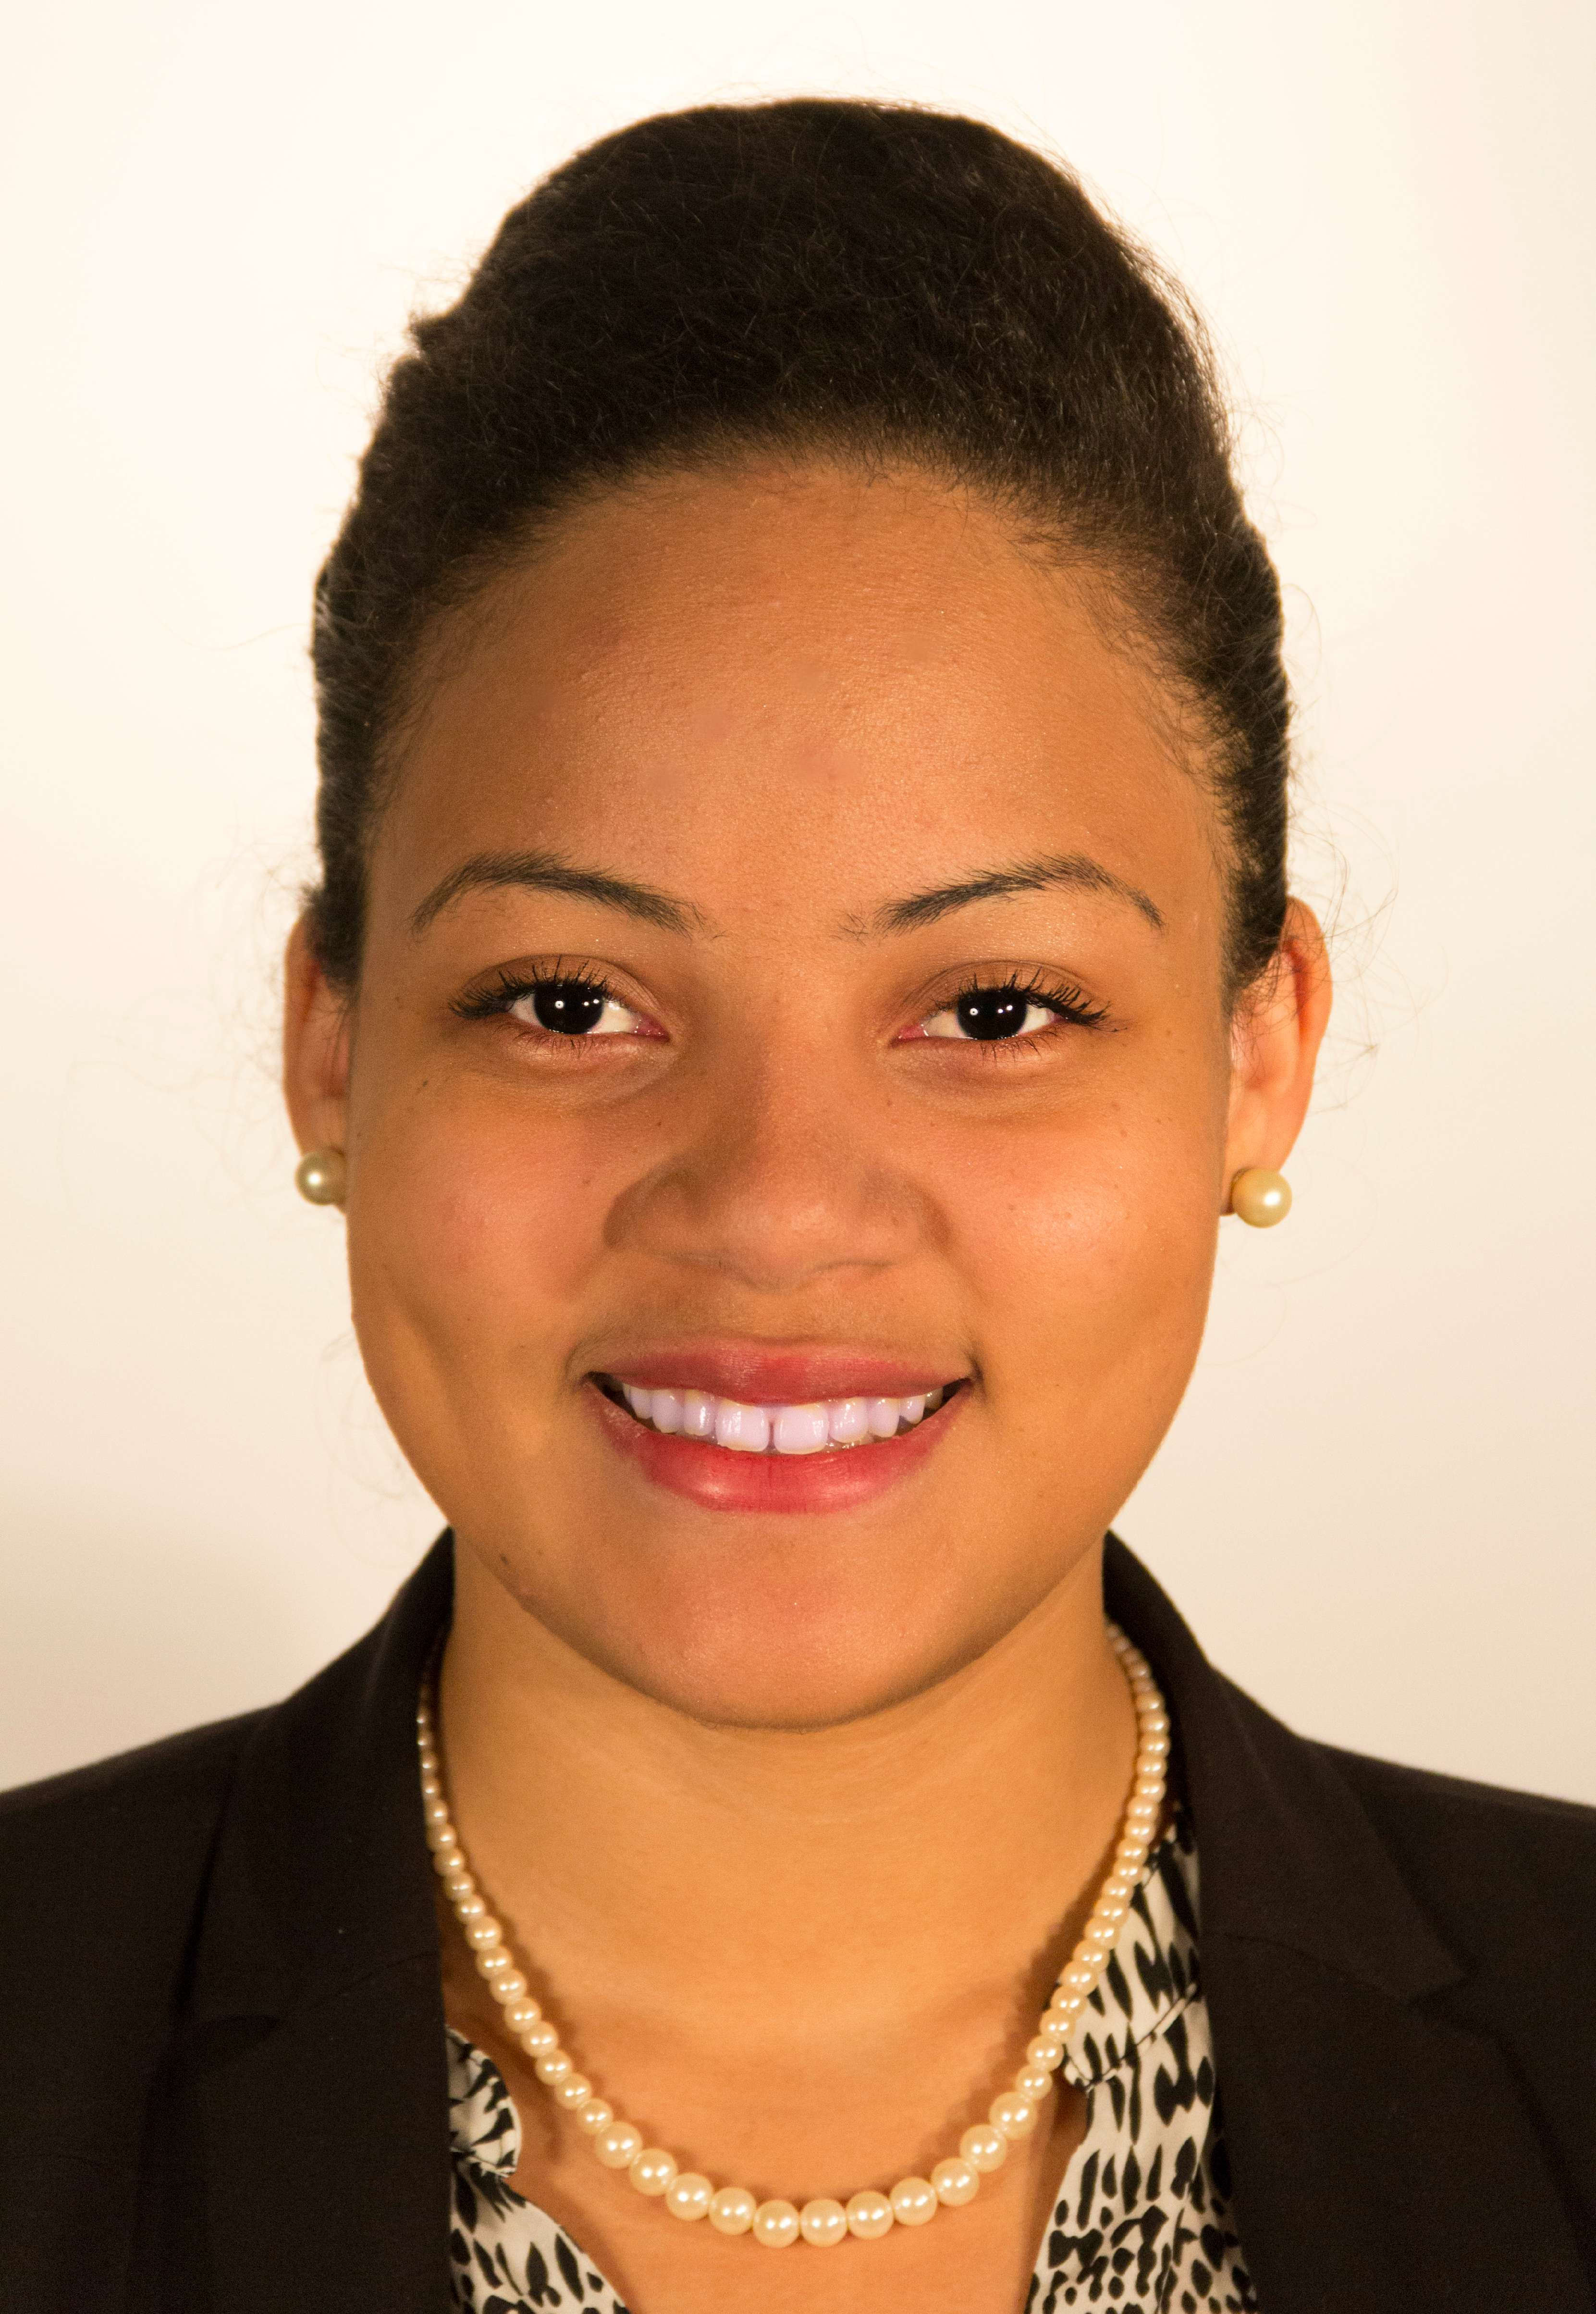 ] .pull-right[ - Statistical programmer, MDRC - co-author, [*New York City's Pretrial Supervised Release Program*](https://storage.googleapis.com/vera-web-assets/downloads/Publications/new-york-citys-pretrial-supervised-release-program/legacy_downloads/Supervised-Release-Brief-2017.pdf) - 2015: BA, psychology, Smith ] --- ## [Rutendo Madziwo '19](https://www.linkedin.com/in/rutendo-madziwo/) .pull-left[ - Associate Analyst, MasterCard - Co-Founder, Co-President, Smithies in SDS - 2019: BA, statistical and data sciences, Smith ] .pull-right[ .center[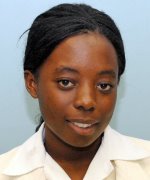] ] --- class: center, middle, inverse # This course --- ## Topics .pull-left[ - Data visualization - Data wrangling - Spatial data - Database querying (SQL) - ~~Data journalism~~ .footnote[We'll share a Slack with SDS 236 students!] </br> ] .pull-right[     ] --- ## Practice of data science .pull-left[     ] .pull-right[ - Reproducible workflows - R + R Markdown + RStudio - GitHub - Slack - DataCamp - `tidyverse` - Ethics ] --- ## Textbook (required) .pull-left[ <img src="https://images.tandf.co.uk/common/jackets/amazon/978149872/9781498724487.jpg" width="300px"> ] .pull-right[ - http://mdsr-book.github.io - Bookstore (~$100) - [CRC Press](https://www.crcpress.com/Modern-Data-Science-with-R/Baumer-Kaplan-Horton/p/book/9781498724487) - [Amazon](https://www.amazon.com/Modern-Data-Science-Download-Statistical/dp/1498724485) - Library has two copies - [Online version](https://beanumber.github.io/mdsr2e/) available (still a bit rough!) - **Read it!!** ] --- ## Assignments .pull-left[ - Homework (20%) - Labs (20%) - Midterm (15%) - Mini-projects (35%) - Participation (10%) - Extra credit ($\epsilon$) ] .pull-right[ <img src="https://3.bp.blogspot.com/-bve9jwk20AE/V22ZRL9zZZI/AAAAAAAAqXo/C5OZ6Lnh62cvlsLXD3W5TbctTi40t2lCwCLcB/s640/Title%2BImage.png" class="one-col-image"> ] --- ## Resources - Course website (http://beanumber.github.io/sds192) - Slack (http://baumerland-s20.slack.com) - Office hours (M 1:20--2:35, W 2--3:30) - Data assistants - [Stat TAs](https://www.smith.edu/qlc/tutoring.html) - Sun-Thu evenings, 7-9 pm, Sabin-Reed 301 - Spinelli Center --- ## Computing .pull-left[ - We'll be doing lots of it! - Please bring a laptop to class - DM me on Slack if you don't have one - Chromebooks are OK - **Don't email me!** ] .pull-right[ <img src="https://media.giphy.com/media/hOzfvZynn9AK4/giphy.gif" class="one-col-image"> ] --- class: center, middle, inverse ## Let's get started! --- background-image: url(http://paldhous.github.io/ucb/2016/dataviz/img/class2_1.jpg) background-position: 90% 8% ## Visual cues - Also, **position** --- ## Activity .pull-left[ Four graphics 1. [The World as 100 People](http://thumbnails-visually.netdna-ssl.com/TheWorldas100People_519247ce0980d_w1500.png) 2. [Why so jittery?](http://www.scientificamerican.com/media/inline/why-so-jittery_3.jpg) 3. [The Best and Worst Major Areas](https://s-media-cache-ak0.pinimg.com/736x/e1/b9/5f/e1b95ff47cd9589fb5753c6dbf4758ff.jpg) 4. [Favorite Keys](http://thumbnails-visually.netdna-ssl.com/classical-composers-favorite-keys_5245b157a1124_w1500.png) ] .pull-right[ Three questions 1. Identify the visual cues used 2. How are the variables mapped to the visual cues? 3. Summarize the real-world meaning in one sentence ] --- class: center, middle, inverse # Homework --- ## Slack .center[] .footnote[Set your notifications] --- ## Homework (before Friday) - Join the [SDS 192 Slack team](https://join.slack.com/t/baumerland-s20/shared_invite/enQtOTA3NDIxMjI2Mjg4LTlhZDQ4NmU0NWVmZTlhN2YwMDdiMTRlZDIzYzM5NDg2MmYwNjMzMmFiMjA1MTI1MmE5OTc2YWQyNjUyOTM0ODQ) - If you've never used Slack before, check out: "[Getting started for new users](https://get.slack.help/hc/en-us/articles/218080037-Getting-started-for-new-users)" - Please fill out [pre-course questionnaire](https://docs.google.com/forms/d/1asslSwIgEF-LtXslTka7UnUtzVGYqX0Qo51yuDquPxY/) - (Try to) get RStudio set up... --- ## Homework (before Friday) .pull-left[ Download and install R .center[] (https://cloud.r-project.org/) ] .pull-right[ Download and install RStudio Desktop .center[] (https://www.rstudio.com/products/rstudio/download/) ]