class: center, middle, inverse, title-slide # Taxonomy of Data Graphics ## Mini-Lecture 3 ### Ben Baumer ### SDS 192</br>Jan 31, 2020</br>(<a href="http://beanumber.github.io/sds192/lectures/03-taxonomy.html" class="uri">http://beanumber.github.io/sds192/lectures/03-taxonomy.html</a>) --- class: center, middle, inverse # Announcements --- ## Tips - Put your picture on your Slack profile -- - ...if you want me to learn your name -- - Update your R (3.6.2), RStudio (1.2.5033), and packages - [RStudio Server](http://rstudio.smith.edu/) accounts - note bene: shared resources - If you're still not set up, come see me! - office hours tomorrow **this afernoon** --- ## Apples, oranges, and pears - R vs. RStudio vs. R Markdown -- - [R](https://en.wikipedia.org/wiki/R_(programming_language)) is a **programming language** (e.g. Python) -- - [RStudio](https://en.wikipedia.org/wiki/RStudio) is an application (e.g. Word) -- - [Markdown](https://en.wikipedia.org/wiki/Markdown) is a markup syntax (e.g. HTML) -- - R Markdown is Markdown plus the ability to render R chunks --- ## Quick recap - You installed R - You installed RStudio - You installed the `tidyverse` (hopefully) -- - You should never have to do any of those things again! --- ## The `tidyverse` .pull-left[ > One of the question I am wondering is **what exactly does the `tidyverse` package do**. It says that tidyverse is an umbrella package that encompasses both dplyr and ggplot2, so I am wondering whether it is necessary to load dplyr and ggplot2 if we have already loaded tidyverse. ] .pull-right[  ] -- - No, it is not. --- ## Loading packages > I had trouble knitting the code into the html file. I had an error that it **could not find function** `read_csv()`. After fixing it by adding `library(tidyverse)` -- - You only have to install a package once -- - But you have to load it (e.g. `library()`) each R session -- - And in your Markdown file --- ## Syntax > I was kept on getting error messages when I typed the wrong arrow sign for the mutate function. After a while, I got used to the syntax of R studio as of lab 1. I realized that it is **very important to not make typos** when writing your code, because every little detail matters. -- - spelling counts! -- - spaces don't matter -- - carriage returns do matter -- - style guide later --- class: inverse ## Homework \#1 - Getting started - [Rubric](../hw/hw_viz.html) - Upload `.Rmd` to Moodle by midnight on Sunday - [Troubleshooting R Markdown](https://smithcollege-sds.github.io/sds-www/rmarkdown_problems.html) --- class: center, middle, inverse # Taxonomy of data graphics --- ## Borrowing heavily from Nathan Yau .pull-left[  ] .pull-right[ - PhD in statistics, UCLA - [FlowingData.com](https://flowingdata.com) - Author of - *Data Points* - *Visualize This!* ] --- ## Elements of data graphics - Visual cues - position, length, area, etc. - Coordinate system - how are the data points organized? - Scale - how does distance translate into meaning? - Context - in relation to what? - Faceting / small multiples --- background-image: url(https://s-media-cache-ak0.pinimg.com/originals/c2/46/92/c24692fd95dbfb89f772613a316a5405.png) background-size: contain --- background-image: url(https://i.pinimg.com/736x/90/8f/12/908f129be5844828110233b84056d9f2--data-visualization-points.jpg) background-size: contain --- background-image: url(https://i.pinimg.com/736x/86/a4/93/86a49342761ca36aeca5f8ee03c64867--data-visualization-points.jpg) background-size: contain --- background-image: url(http://www.thedataschool.co.uk/wp-content/uploads/2016/06/Nathan-Yau-3.png) background-size: contain --- background-image: url(https://i.pinimg.com/736x/62/c6/ee/62c6ee636c47dccad00e7e56c268c3bf--data-visualization-points.jpg) background-size: contain --- background-image: url(https://i.pinimg.com/736x/16/06/da/1606dafa2bccb6a99d74b19844b0db60--data-visualization-points.jpg) background-size: contain --- ## Big idea .pull-left[ - Mapping variables to visual cues - But how? - *Grammar of Graphics* (Wilkinson, 1999) - implemented in R as `ggplot2` (Wickham, 2010) ] .pull-right[ .center[] ] --- background-image: url(https://s-media-cache-ak0.pinimg.com/originals/6d/09/3a/6d093a70e7d772a5e90178b8d609462e.png) background-size: contain ## Perceptual heirarchy .footnote[Yau, *Data Points*, 2013] --- ## Do's and don'ts - Mind the perceptual heirarchy - Don't use color when length will suffice - Don't use pie charts! - Don't use redundant mappings unless you have a reason - Do use context! - Match data dimensions to visual dimensions - Don't map area to a 1D quantity --- ## Read more about this! .pull-left[  ] .pull-right[  ] --- ## Two recent books .pull-left[ [](http://socviz.co/) ] .pull-right[ [](https://serialmentor.com/dataviz/) ] --- ## Tufte's mantra .center[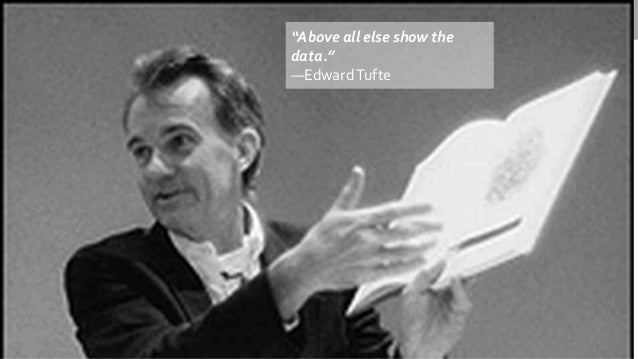] --- class: inverse ## Now 1. Lab \#2: [Deconstructing data graphics](../lab-deconstructing.html) - No submissions - Get credit by responding to prompt on Slack channel `#lab2` - Deadline: before ~~next~~ Monday's class 2. [Homework \#1](../hw/hw_viz.html) - due next Sunday just before midnight