class: center, middle, inverse, title-slide # Working with Geospatial Data ## Projections ### Ben Baumer ### SDS 192</br>April 10th, 2020</br>(<a href="http://beanumber.github.io/sds192/lectures/mdsr_geo_06-projections.html" class="uri">http://beanumber.github.io/sds192/lectures/mdsr_geo_06-projections.html</a>) --- class: center, middle, inverse # Projections --- background-image: url(http://gisedu.colostate.edu/webcontent/nr505/2012_Projects/Team6/images/GIS_concepts/Figure2_proj.PNG) background-size: contain --- ## Principles .footnote[https://en.wikipedia.org/wiki/Map_projection] > "All projections of a sphere on a plane **necessarily distort** the surface in some way and to some extent." -- - Properties: - Area - Shape - Direction - Bearing - Distance -- - Every projection represents a trade-off in accuracy among these proporties --- ## Distortion .center[] --- ## Projections .pull-left[  ] -- .pull-right[ - It's complicated (non-trivial math) - There is no one "best" projection - Explore: (https://bl.ocks.org/mbostock/raw/3711652/) ] -- .center[**Important!!: Not OK to pretend like projections don't matter**] --- ## [Mercator](https://en.wikipedia.org/wiki/Mercator_projection) (preserves angles)  --- ## [Gall-Peters](https://en.wikipedia.org/wiki/Gall–Peters_projection) (preserves area) .footnote[https://en.wikipedia.org/wiki/Gall%E2%80%93Peters_projection#Controversy]  --- ## [Albers Equal Area](https://en.wikipedia.org/wiki/Albers_projection) 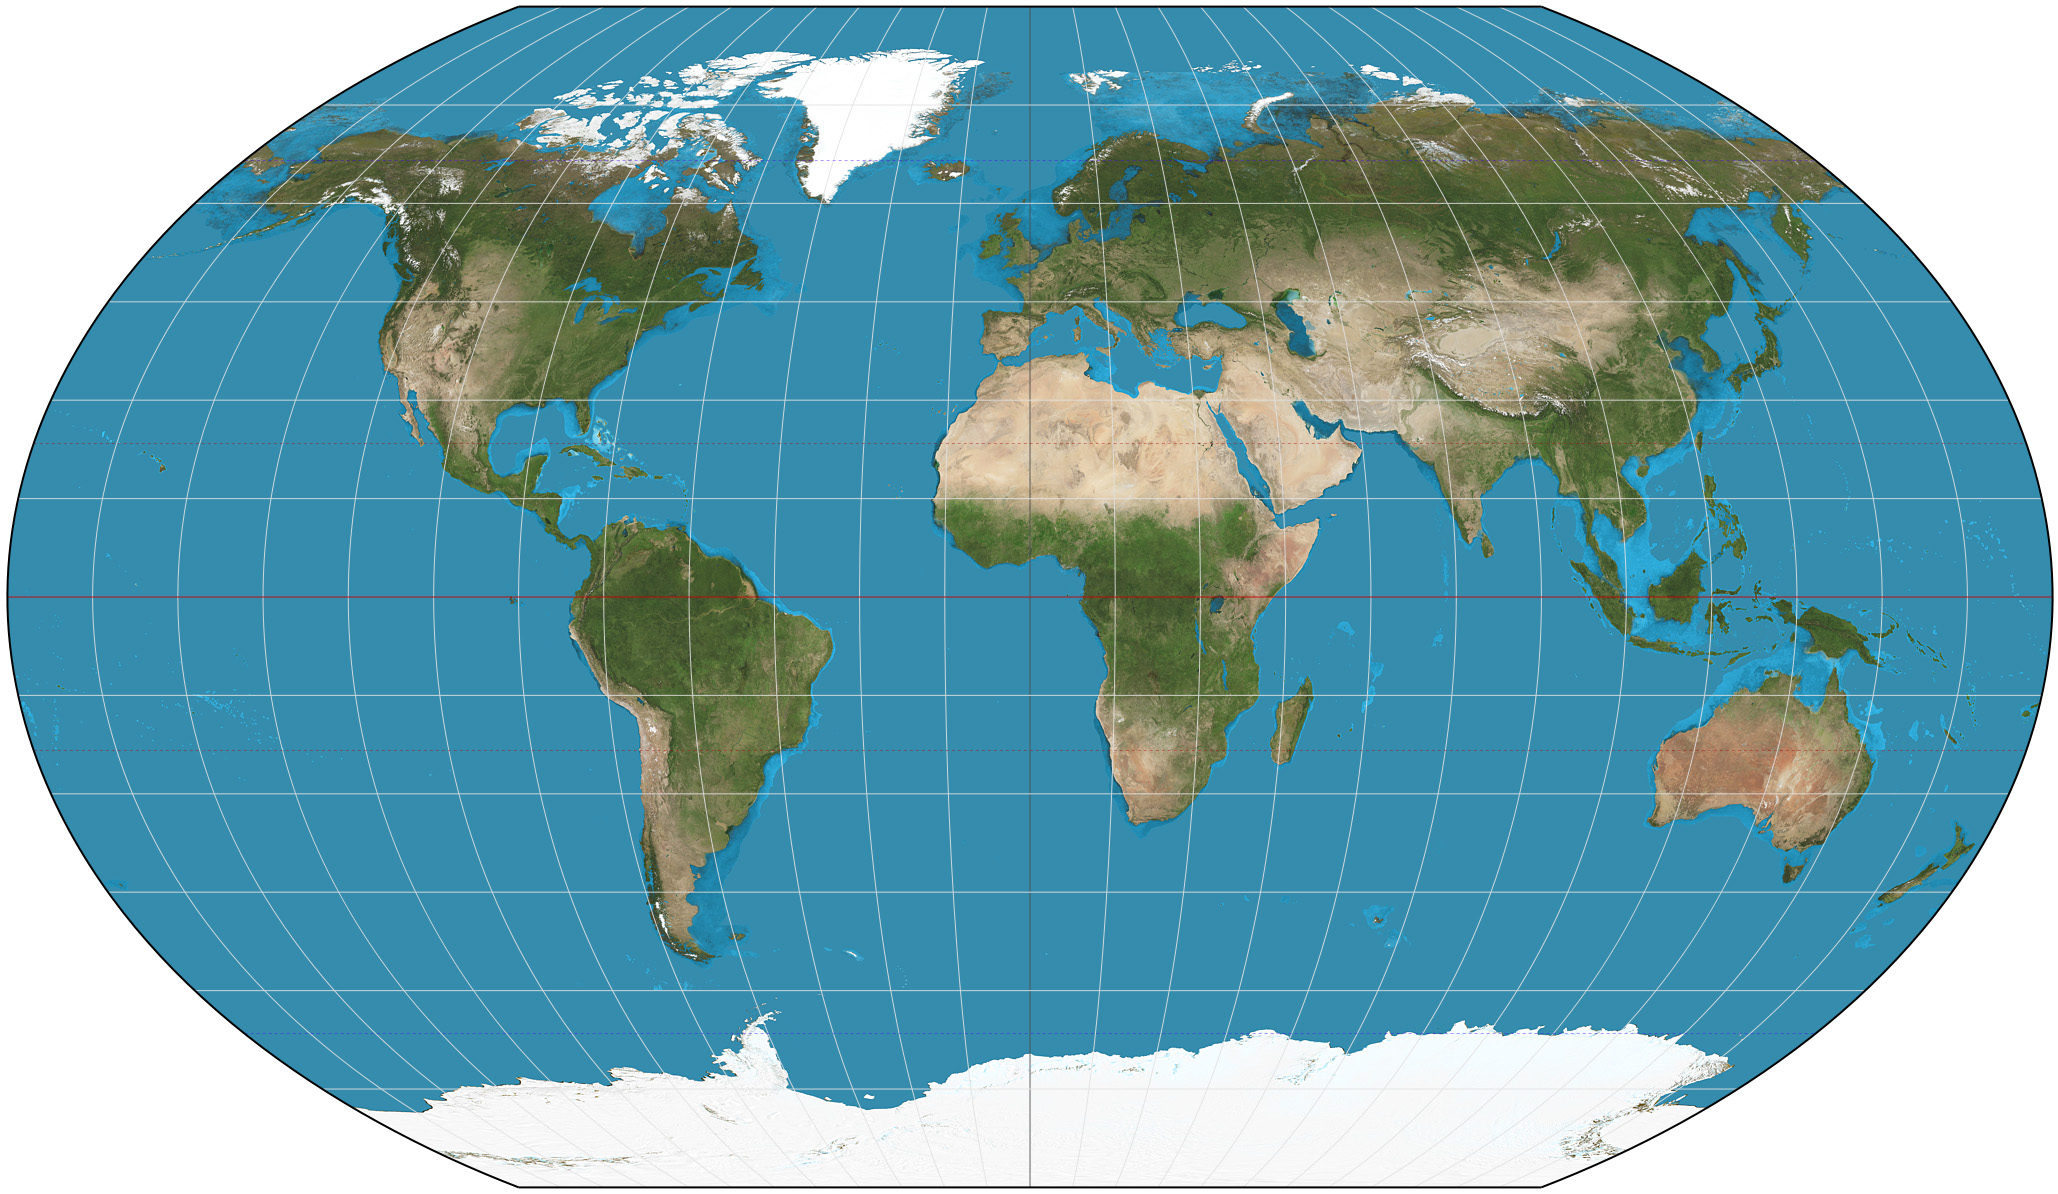 --- ## [Lambert Conformal Conic](https://en.wikipedia.org/wiki/Lambert_conformal_conic_projection) 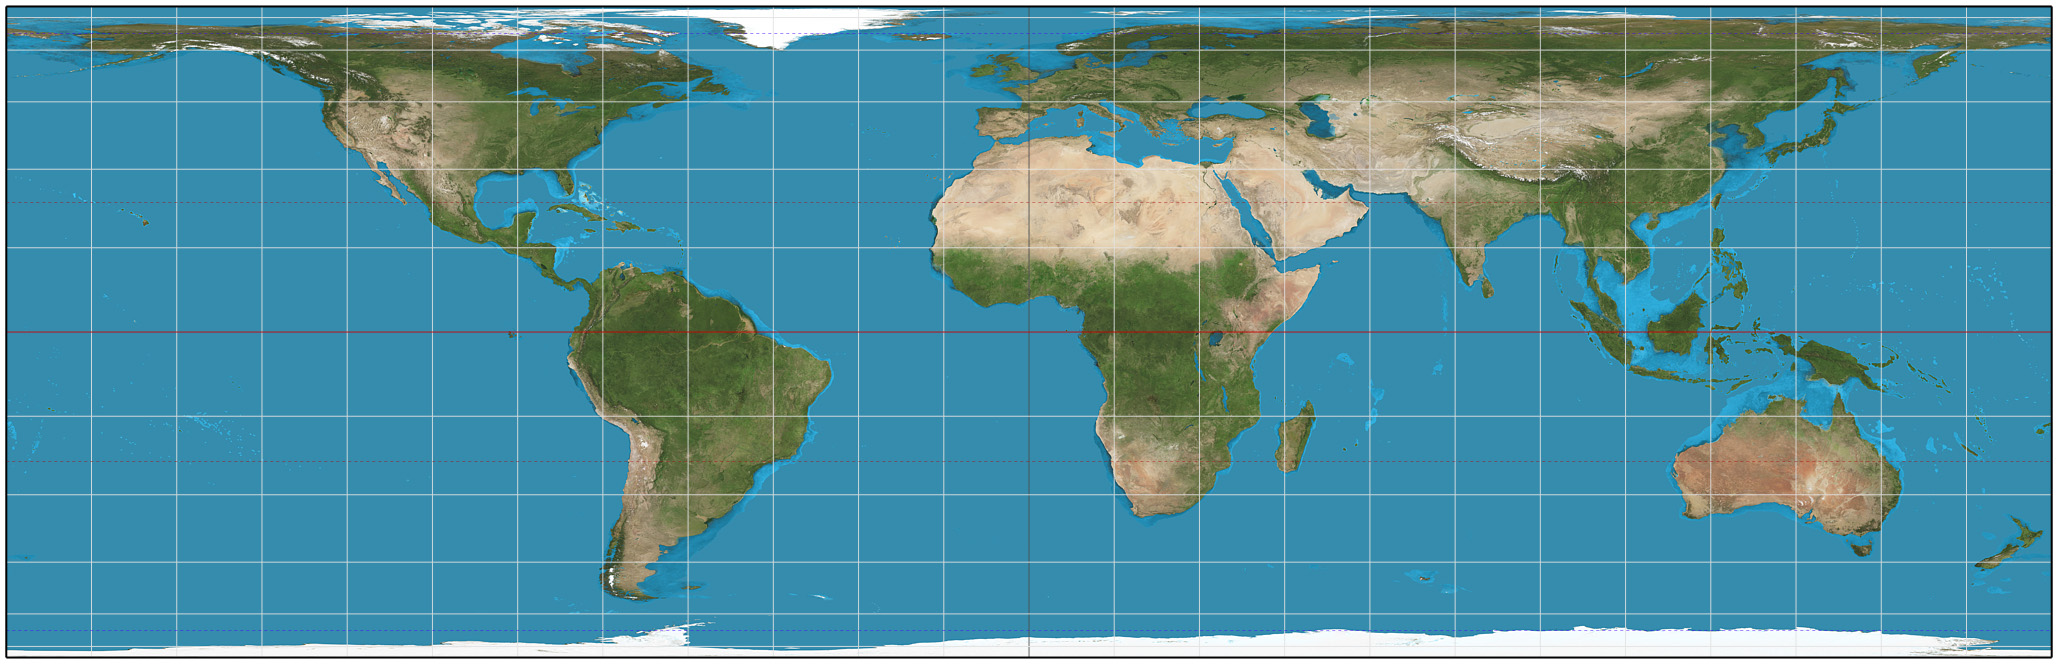 --- ## PROJ.4 strings and EPSG ```r library(sf) library(macleish) # GPS, Google Earth, Leaflet st_crs(4326) ``` ``` ## Coordinate Reference System: ## User input: EPSG:4326 ## wkt: ## GEOGCS["WGS 84", ## DATUM["WGS_1984", ## SPHEROID["WGS 84",6378137,298.257223563, ## AUTHORITY["EPSG","7030"]], ## AUTHORITY["EPSG","6326"]], ## PRIMEM["Greenwich",0, ## AUTHORITY["EPSG","8901"]], ## UNIT["degree",0.0174532925199433, ## AUTHORITY["EPSG","9122"]], ## AUTHORITY["EPSG","4326"]] ``` .footnote[https://epsg.io/4326] --- ## Checking projections ```r macleish_layers %>% pluck("buildings") %>% st_crs() ``` ``` ## Coordinate Reference System: ## User input: EPSG:4326 ## wkt: ## GEOGCS["WGS 84", ## DATUM["WGS_1984", ## SPHEROID["WGS 84",6378137,298.257223563, ## AUTHORITY["EPSG","7030"]], ## AUTHORITY["EPSG","6326"]], ## PRIMEM["Greenwich",0, ## AUTHORITY["EPSG","8901"]], ## UNIT["degree",0.0174532925199433, ## AUTHORITY["EPSG","9122"]], ## AUTHORITY["EPSG","4326"]] ``` --- ## Units really matter!! ```r macleish_layers %>% pluck("buildings") %>% st_bbox() ``` ``` ## xmin ymin xmax ymax ## -72.68251 42.44104 -72.67923 42.44919 ``` --- ## Projecting geospatial data ```r buildings_3857 <- macleish_layers %>% pluck("buildings") %>% * st_transform(3857) buildings_3857 %>% st_bbox() ``` ``` ## xmin ymin xmax ymax ## -8090979 5227276 -8090614 5228505 ``` --- ## Oops! ```r library(leaflet) leaflet() %>% addTiles() %>% # No error, but puts buildings at North Pole! addPolygons(data = buildings_3857, popup = ~name) ``` <div id="htmlwidget-4454f765728c3308880a" style="width:504px;height:360px;" class="leaflet html-widget"></div> <script type="application/json" data-for="htmlwidget-4454f765728c3308880a">{"x":{"options":{"crs":{"crsClass":"L.CRS.EPSG3857","code":null,"proj4def":null,"projectedBounds":null,"options":{}}},"calls":[{"method":"addTiles","args":["//{s}.tile.openstreetmap.org/{z}/{x}/{y}.png",null,null,{"minZoom":0,"maxZoom":18,"tileSize":256,"subdomains":"abc","errorTileUrl":"","tms":false,"noWrap":false,"zoomOffset":0,"zoomReverse":false,"opacity":1,"zIndex":1,"detectRetina":false,"attribution":"© <a href=\"http://openstreetmap.org\">OpenStreetMap<\/a> contributors, <a href=\"http://creativecommons.org/licenses/by-sa/2.0/\">CC-BY-SA<\/a>"}]},{"method":"addPolygons","args":[[[[{"lng":[-8090763.01964324,-8090753.2624485,-8090753.16285252,-8090762.92003987,-8090763.01964324],"lat":[5228385.75520565,5228385.89075171,5228378.66841783,5228378.53287197,5228385.75520565]}]],[[{"lng":[-8090757.68467349,-8090757.06645846,-8090756.46553217,-8090755.90015348,-8090755.38750116,-8090754.94315188,-8090754.58060699,-8090754.31088221,-8090754.14217298,-8090754.07960543,-8090754.12508063,-8090754.27721681,-8090754.53139137,-8090754.87988133,-8090755.312098,-8090755.81490868,-8090756.37303575,-8090756.96952079,-8090757.58623994,-8090758.20445451,-8090758.80538039,-8090759.37075877,-8090759.88341093,-8090760.32776019,-8090760.69030523,-8090760.9600303,-8090761.12873992,-8090761.19130792,-8090761.14583318,-8090760.99369741,-8090760.73952316,-8090760.39103337,-8090759.95881671,-8090759.45600588,-8090758.89787853,-8090758.30139309,-8090757.68467349],"lat":[5228370.42135256,5228370.37571069,5228370.22301634,5228369.96790906,5228369.61814019,5228369.18433728,5228368.67968123,5228368.11950579,5228367.52083163,5228366.90184915,5228366.28136584,5228365.67823477,5228365.11078175,5228364.59624855,5228364.15026897,5228363.78639386,5228363.51567936,5228363.34635098,5228363.28355366,5228363.32919546,5228363.48188959,5228363.73699652,5228364.08676497,5228364.52056741,5228365.02522302,5228365.5853981,5228366.18407203,5228366.8030544,5228367.42353778,5228368.02666908,5228368.59412244,5228369.10865607,5228369.55463611,5228369.91851166,5228370.18922652,5228370.35855515,5228370.42135256]}]],[[{"lng":[-8090837.62291594,-8090825.66734653,-8090825.76979257,-8090837.72534232,-8090837.62291594],"lat":[5228090.14215192,5228090.06346621,5228074.38477314,5228074.46345859,5228090.14215192]}]],[[{"lng":[-8090829.35098241,-8090820.32542465,-8090820.82798886,-8090829.85352349,-8090829.35098241],"lat":[5228074.40834434,5228074.22154282,5228049.76148641,5228049.94828697,5228074.40834434]}]],[[{"lng":[-8090849.36022338,-8090847.64895794,-8090857.78966578,-8090859.50094768,-8090849.36022338],"lat":[5228039.04734146,5228023.39642026,5228022.2794819,5228037.93039943,5228039.04734146]}]],[[{"lng":[-8090850.47603237,-8090841.05743702,-8090843.53869116,-8090852.95728243,-8090850.47603237],"lat":[5227892.40797523,5227887.9622943,5227882.66687366,5227887.11254967,5227892.40797523]}]],[[{"lng":[-8090852.95728243,-8090845.94803723,-8090850.39926855,-8090857.4085083,-8090852.95728243],"lat":[5227887.11254967,5227883.80411192,5227874.30440782,5227877.61283901,5227887.11254967]}]],[[{"lng":[-8090814.13663207,-8090806.61129543,-8090809.16755755,-8090816.69288912,-8090814.13663207],"lat":[5227806.43067491,5227803.78091976,5227796.46772665,5227799.11747774,5227806.43067491]}]],[[{"lng":[-8090809.16755754,-8090819.53265252,-8090829.29579837,-8090818.93072661,-8090809.16755754],"lat":[5227796.46772665,5227769.74978188,5227773.56518565,5227800.28315175,5227796.46772665]}]],[[{"lng":[-8090860.13058715,-8090848.30075064,-8090853.78814069,-8090865.61796775,-8090860.13058715],"lat":[5227768.14630536,5227761.91419935,5227751.4214028,5227757.65349513,5227768.14630536]}]],[[{"lng":[-8090850.37261321,-8090838.70643941,-8090846.01822107,-8090857.68438183,-8090850.37261321],"lat":[5227757.59313206,5227751.62620807,5227737.2255355,5227743.19244153,5227757.59313206]}]],[[{"lng":[-8090847.5060609,-8090850.15405459,-8090856.51544174,-8090853.86745062,-8090847.5060609],"lat":[5227737.98652383,5227732.77124851,5227736.024914,5227741.24019288,5227737.98652383]}]],[[{"lng":[-8090822.12440817,-8090821.9307867,-8090844.66018766,-8090844.85384905,-8090822.12440817],"lat":[5227547.3223974,5227530.58151235,5227530.31666873,5227547.05755288,5227547.3223974]}]],[[{"lng":[-8090844.7385351,-8090848.77864387,-8090848.85845939,-8090844.81834769,-8090844.7385351],"lat":[5227537.08934549,5227537.04226429,5227543.94159022,5227543.98867149,5227537.08934549]}]],[[{"lng":[-8090848.85845939,-8090848.73186863,-8090859.90227595,-8090860.02887734,-8090848.85845939],"lat":[5227543.94159022,5227534.8803369,5227534.72312598,5227543.78437899,5227543.94159022]}]],[[{"lng":[-8090860.02887734,-8090860.06087205,-8090848.89045141,-8090848.85845939,-8090860.02887734],"lat":[5227543.78437899,5227546.07433823,5227546.23154954,5227543.94159022,5227543.78437899]}]],[[{"lng":[-8090822.0828609,-8090819.17672905,-8090818.99894692,-8090821.90507407,-8090822.0828609],"lat":[5227543.73014295,5227543.76400139,5227528.39220534,5227528.35834702,5227543.73014295]}]],[[{"lng":[-8090821.90507406,-8090831.03397237,-8090831.05968714,-8090821.9307867,-8090821.90507406],"lat":[5227528.35834702,5227528.25198341,5227530.47514871,5227530.58151236,5227528.35834702]}]],[[{"lng":[-8090972.49035324,-8090961.29211724,-8090968.2897108,-8090979.48790191,-8090972.49035324],"lat":[5227463.73120786,5227461.73094194,5227422.26775926,5227424.26800868,5227463.73120786]}]],[[{"lng":[-8090966.98572159,-8090963.30497376,-8090960.95670218,-8090964.63745498,-8090966.98572159],"lat":[5227429.62166655,5227450.37938196,5227449.95992471,5227429.20221113,5227429.62166655]}]],[[{"lng":[-8090944.46682248,-8090930.29453849,-8090941.91077119,-8090956.08301082,-8090944.46682248],"lat":[5227557.16830981,5227552.26915608,5227518.4185928,5227523.31771187,5227557.16830981]}]],[[{"lng":[-8090845.70646557,-8090845.00865615,-8090891.44144325,-8090892.13931365,-8090845.70646557],"lat":[5227376.42073309,5227363.86604689,5227361.26614683,5227373.8208262,5227376.42073309]}]],[[{"lng":[-8090859.42175991,-8090845.00865615,-8090844.22695329,-8090858.64001942,-8090859.42175991],"lat":[5227363.41059721,5227363.86604689,5227338.94582037,5227338.49037305,5227363.41059721]}]],[[{"lng":[-8090844.90999606,-8090811.07839926,-8090810.24379935,-8090844.07530179,-8090844.90999606],"lat":[5227360.72082535,5227361.7898068,5227335.18022779,5227334.11125229,5227360.72082535]}]],[[{"lng":[-8090832.67145514,-8090783.00462728,-8090781.37019556,-8090831.03696511,-8090832.67145514],"lat":[5227287.84280701,5227295.00115289,5227283.57734104,5227276.41901225,5227287.84280701]}]],[[{"lng":[-8090642.90752461,-8090626.82111388,-8090626.1399313,-8090615.78609778,-8090614.414299,-8090627.0750274,-8090627.2268052,-8090632.0542767,-8090630.45346273,-8090633.31934297,-8090632.70318109,-8090639.06766262,-8090639.89198575,-8090642.82894927,-8090644.40298187,-8090650.08181653,-8090651.3886199,-8090642.22633607,-8090642.90752461],"lat":[5228502.13945494,5228504.82530414,5228501.17602734,5228502.72692821,5228494.72489926,5228492.71983816,5228493.56211067,5228492.86189147,5228483.52647163,5228482.92377866,5228478.9218464,5228477.84844811,5228481.70680219,5228481.17350539,5228489.40965226,5228488.60135556,5228496.95579061,5228498.49018033,5228502.13945494]}]],[[{"lng":[-8090731.01389104,-8090680.67611448,-8090681.07900545,-8090731.2042838,-8090731.01389104],"lat":[5228166.22799134,5228164.45911096,5228153.47224759,5228154.75603471,5228166.22799134]}]]],null,null,{"interactive":true,"className":"","stroke":true,"color":"#03F","weight":5,"opacity":0.5,"fill":true,"fillColor":"#03F","fillOpacity":0.2,"smoothFactor":1,"noClip":false},[0,0,0,0,0,0,0,0,0,0,0,0,0,0,0,0,0,0,0,0,0,0,0,0,0,0,0],null,null,{"interactive":false,"permanent":false,"direction":"auto","opacity":1,"offset":[0,0],"textsize":"10px","textOnly":false,"className":"","sticky":true},null]}],"limits":{"lat":[5227276.41901225,5228504.82530414],"lng":[-8090979.48790191,-8090614.414299]}},"evals":[],"jsHooks":[]}</script> --- ## Projections checklist - <i class="fas fa-check-square "></i>: Are you using `leaflet`? - Project everything in EPSG 4326 -- - <i class="fas fa-check-square "></i>: Are you using `ggplot2`? - Choose a projection scheme that is appropriate for your data - Project everything in that scheme