class: center, middle, inverse, title-slide # Data visualization ## Taxonomy of Data Graphics ### Ben Baumer ### SDS 192</br>Sep 7, 2020</br>(<a href="http://beanumber.github.io/sds192/lectures/mdsr_viz_01-taxonomy.html" class="uri">http://beanumber.github.io/sds192/lectures/mdsr_viz_01-taxonomy.html</a>) --- ## Borrowing heavily from Nathan Yau .footnote[https://flowingdata.com/data-points/] .pull-left[  ] .pull-right[ - PhD in statistics, UCLA - [FlowingData.com](https://flowingdata.com) - Author of - *Data Points* - *Visualize This!* ] --- ## Elements of data graphics - Visual cues - position, length, area, etc. - Coordinate system - how are the data points organized? - Scale - how does distance translate into meaning? - Context - **in relation to what?** - Faceting / small multiples --- background-image: url(https://s-media-cache-ak0.pinimg.com/originals/c2/46/92/c24692fd95dbfb89f772613a316a5405.png) background-size: contain --- background-image: url(https://i.pinimg.com/736x/90/8f/12/908f129be5844828110233b84056d9f2--data-visualization-points.jpg) background-size: contain --- background-image: url(https://i.pinimg.com/736x/86/a4/93/86a49342761ca36aeca5f8ee03c64867--data-visualization-points.jpg) background-size: contain --- background-image: url(http://www.thedataschool.co.uk/wp-content/uploads/2016/06/Nathan-Yau-3.png) background-size: contain --- background-image: url(https://i.pinimg.com/736x/62/c6/ee/62c6ee636c47dccad00e7e56c268c3bf--data-visualization-points.jpg) background-size: contain --- background-image: url(https://i.pinimg.com/736x/16/06/da/1606dafa2bccb6a99d74b19844b0db60--data-visualization-points.jpg) background-size: contain --- ## Big idea .pull-left[ - Mapping variables to visual cues - But how? - *Grammar of Graphics* (Wilkinson, 1999) - implemented in R as `ggplot2` (Wickham, 2010) ] .pull-right[ .center[] ] --- background-image: url(https://s-media-cache-ak0.pinimg.com/originals/6d/09/3a/6d093a70e7d772a5e90178b8d609462e.png) background-size: contain ## Perceptual heirarchy .footnote[Yau, *Data Points*, 2013] --- ## Do's and don'ts - **Do**: mind the perceptual heirarchy - **Don't** use color when length will suffice - **Don't** use pie charts! - **Don't** use redundant mappings unless you have a reason - **Do** use context! - **Do** match data dimensions to visual dimensions - **Don't** map area to a 1D quantity --- ## Read more about this! .pull-left[ 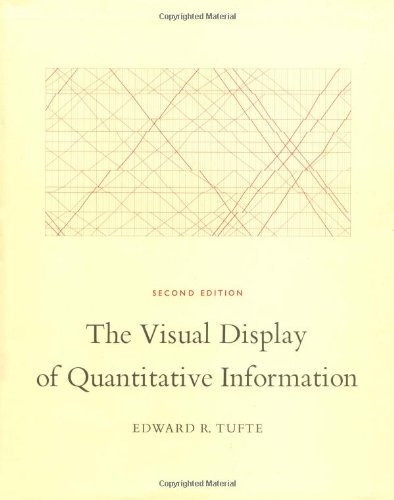 ] .pull-right[ 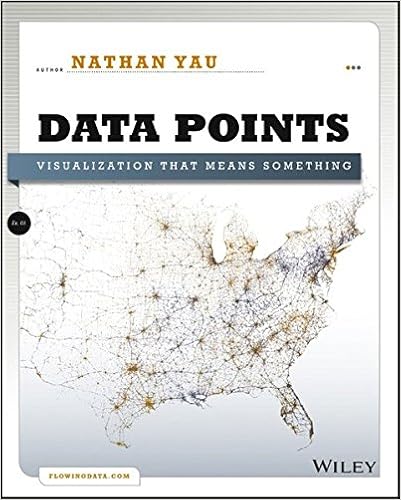 ] --- ## Two recent books .pull-left[ [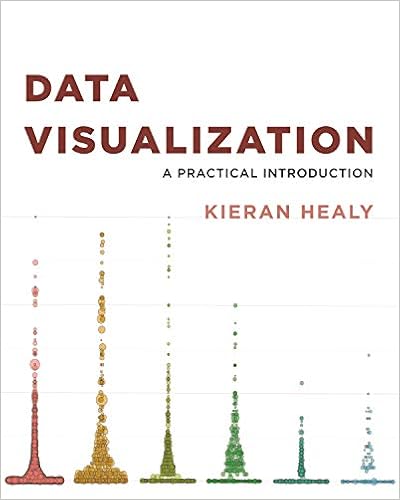](http://socviz.co/) ] .pull-right[ [](https://clauswilke.com/dataviz/) ] --- ## Tufte's mantra .center[]