class: center, middle, inverse, title-slide # Data visualization ## Color and Themes ### Ben Baumer ### SDS 192</br>Feb 7, 2020</br>(<a href="http://beanumber.github.io/sds192/lectures/mdsr_viz_05-color.html" class="uri">http://beanumber.github.io/sds192/lectures/mdsr_viz_05-color.html</a>) --- class: center, middle, inverse # Color --- ## Three color schemes .pull-left[ - Sequential - Single hue - Multi-hue - Diverging - Categorical ] .pull-right[  ] -- Big Idea: color **choices matter** and there are better and worse choices --- ## Sequential, single hue .pull-left[ 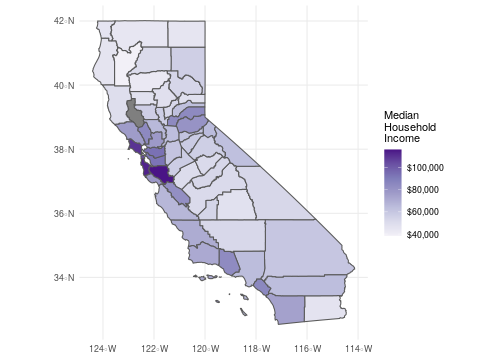<!-- --> ] .pull-right[ - Map [**saturation**](https://en.wikipedia.org/wiki/Colorfulness) to numeric variable - No more than 5--6 levels - People interpret high saturation as more ] --- ## Sequential, single hue .pull-left[ 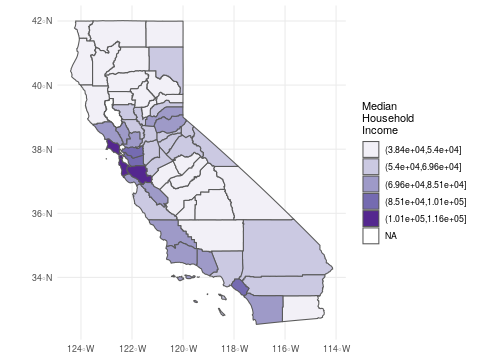<!-- --> ] .pull-right[ - Map [**saturation**](https://en.wikipedia.org/wiki/Colorfulness) to numeric variable - **No more than 5--6 levels** - People interpret high saturation as more ] --- ## Sequential, double hue .pull-left[ - Map [**hue**](https://en.wikipedia.org/wiki/Hue) to numeric variable - Generally, no more than 2 anchor colors - People interpret darker hue as more ] .pull-right[ 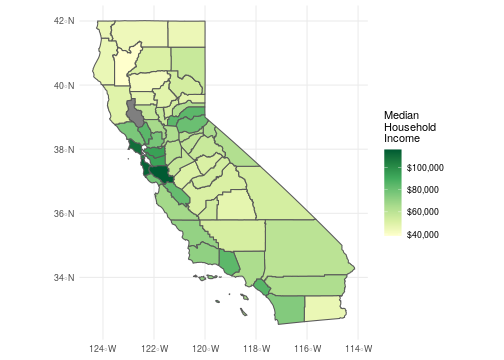<!-- --> ] --- ## Diverging .pull-left[ 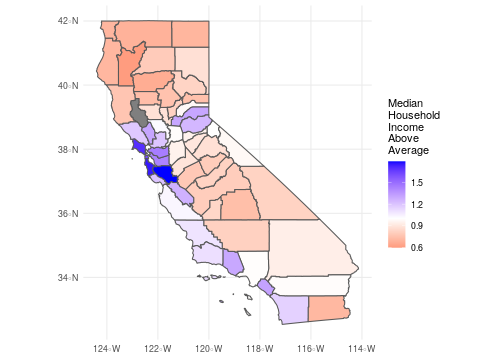<!-- --> ] .pull-right[ - Two colors used to indicate extremes of a range - Neutral color in the middle - distinguish between *zero* and *missing* ] --- ## Categorical .pull-left[ - Different color = different category - choose colors that are - perceptually distant - roughly the same saturation ] .pull-right[ 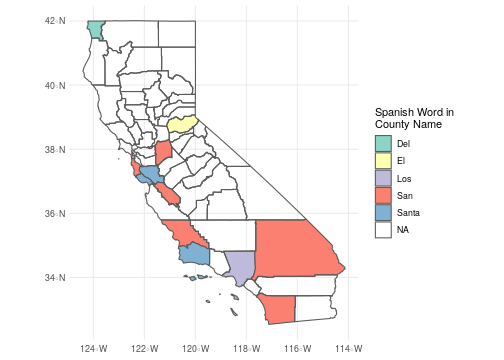<!-- --> ] --- ## Built-in color palettes - Cynthia Brewer .footnote[http://www.colorbrewer2.org] - `RColorBrewer` package - `scale_color_brewer()` function - [`viridis`](https://cran.r-project.org/web/packages/viridis/vignettes/intro-to-viridis.html) palettes mimic `matplotlib` Python library --- ## Sorry, no rainbows .pull-left[  ] .pull-right[ - ❌ 🌈 NO RAINBOWS!! - [Why rainbow colors aren’t the best option for data visualizations](https://www.poynter.org/archive/2013/why-rainbow-colors-arent-always-the-best-options-for-data-visualizations/) - [How The Rainbow Color Map Misleads](https://eagereyes.org/basics/rainbow-color-map) ] .footnote[https://policyviz.com/2018/08/07/dataviz-cheatsheet/] --- ## `ggplot2` default color ```r library(tidyverse) rand_data <- data.frame(x = rnorm(10000), y = rnorm(10000)) norm_plot <- ggplot(rand_data, aes(x = x, y = y)) + geom_hex() + coord_fixed() norm_plot ``` 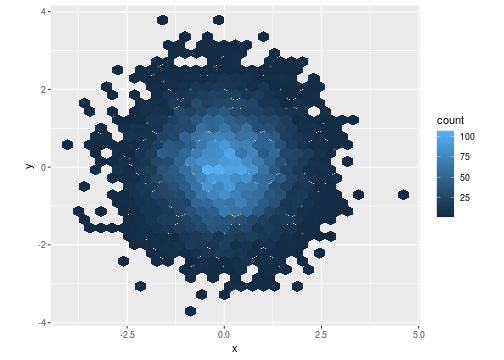<!-- --> --- ## ColorBrewer `Purples` palette ```r norm_plot + scale_fill_distiller(palette = "Purples") ``` 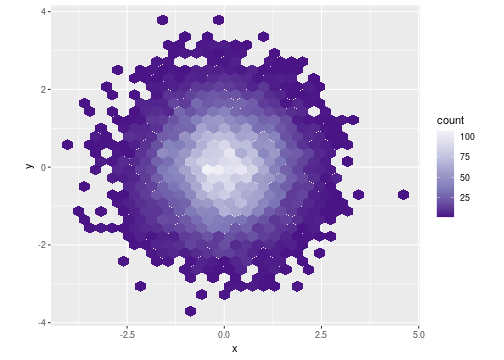<!-- --> --- ## ColorBrewer `YlGn` palette ```r norm_plot + scale_fill_distiller(palette = "YlGn") ``` 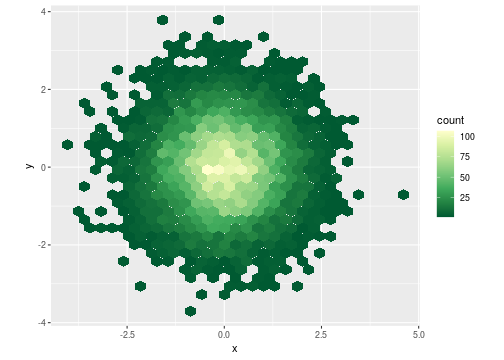<!-- --> --- ## Viridis palette ```r norm_plot + scale_fill_viridis_c() ``` 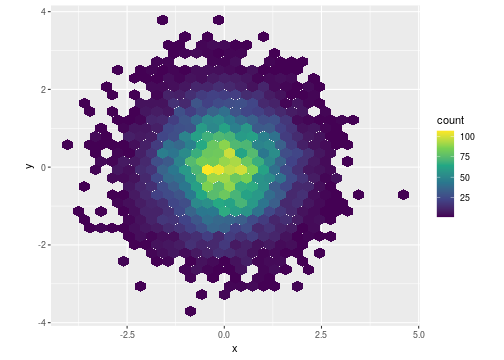<!-- --> --- class: center, middle, inverse # Themes --- ## Take any ggplot... ```r library(tidyverse) p1 <- ggplot(mtcars, aes(x = disp, y = mpg, color = factor(cyl))) + geom_point() p1 ``` 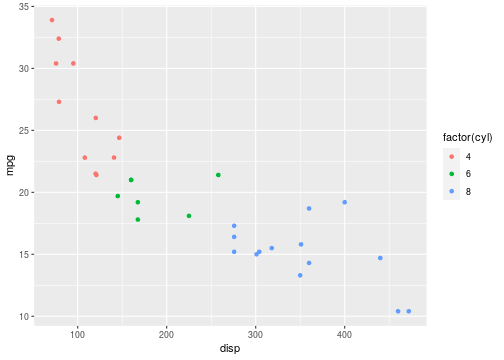<!-- --> --- ## ...and change themes with `ggthemes` .footnote[https://github.com/jrnold/ggthemes] ```r library(ggthemes) p1 + theme_wsj() ``` 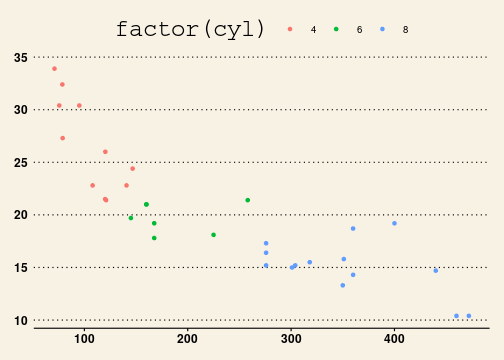<!-- -->