class: center, middle, inverse, title-slide # Data visualization ## ggplot debugging ### Ben Baumer ### SDS 192</br>Sep 16, 2020</br>(<a href="http://beanumber.github.io/sds192/lectures/mdsr_viz_06-debugging.html" class="uri">http://beanumber.github.io/sds192/lectures/mdsr_viz_06-debugging.html</a>) --- ## Function not found - Problem: functions can't be found ```r glimpse(storms) ``` ``` ## Error in glimpse(storms): could not find function "glimpse" ``` ```r my_storms <- storms %>% filter(year == 1995) ``` ``` ## Error in storms %>% filter(year == 1995): could not find function "%>%" ``` --- ## Function not found (cont'd) - Solution: load packages that provide functions ```r library(tidyverse) glimpse(storms) ``` ``` ## Rows: 10,010 ## Columns: 13 ## $ name <chr> "Amy", "Amy", "Amy", "Amy", "Amy", "Amy", "Amy", "Amy", "… ## $ year <dbl> 1975, 1975, 1975, 1975, 1975, 1975, 1975, 1975, 1975, 197… ## $ month <dbl> 6, 6, 6, 6, 6, 6, 6, 6, 6, 6, 6, 6, 6, 6, 6, 6, 7, 7, 7, … ## $ day <int> 27, 27, 27, 27, 28, 28, 28, 28, 29, 29, 29, 29, 30, 30, 3… ## $ hour <dbl> 0, 6, 12, 18, 0, 6, 12, 18, 0, 6, 12, 18, 0, 6, 12, 18, 0… ## $ lat <dbl> 27.5, 28.5, 29.5, 30.5, 31.5, 32.4, 33.3, 34.0, 34.4, 34.… ## $ long <dbl> -79.0, -79.0, -79.0, -79.0, -78.8, -78.7, -78.0, -77.0, -… ## $ status <chr> "tropical depression", "tropical depression", "tropical d… ## $ category <ord> -1, -1, -1, -1, -1, -1, -1, -1, 0, 0, 0, 0, 0, 0, 0, 0, 0… ## $ wind <int> 25, 25, 25, 25, 25, 25, 25, 30, 35, 40, 45, 50, 50, 55, 6… ## $ pressure <int> 1013, 1013, 1013, 1013, 1012, 1012, 1011, 1006, 1004, 100… ## $ ts_diameter <dbl> NA, NA, NA, NA, NA, NA, NA, NA, NA, NA, NA, NA, NA, NA, N… ## $ hu_diameter <dbl> NA, NA, NA, NA, NA, NA, NA, NA, NA, NA, NA, NA, NA, NA, N… ``` --- ## Package not found - Problem: package is not installed ```r library(imadethisup) ``` ``` ## Error in library(imadethisup): there is no package called 'imadethisup' ``` --- ## Package not found (cont'd) - Solution: install package ```r install.packages("imadethisup") library(imadethisup) ``` --- ## Re-installing packages - Problem: Unnecessary and will slow down knitting ```r install.packages("nasaweather") ``` -- - Solutions: - ✅ delete that command - comment out command with `#` - use `eval=FALSE` --- ## Suppress code evaluation - Problem: want to show code but not evaluate it ```r install.packages("nasaweather") ``` - Solution: use `eval=FALSE` ```{r, eval=FALSE} install.packages("nasaweather") ``` --- ## Suppressing messages - Problem: unwanted messages in output ```r library(mosaic) ``` ``` ## Loading required package: lattice ``` ``` ## Loading required package: ggformula ``` ``` ## Loading required package: ggstance ``` ``` ## ## Attaching package: 'ggstance' ``` ``` ## The following objects are masked from 'package:ggplot2': ## ## geom_errorbarh, GeomErrorbarh ``` ``` ## ## New to ggformula? Try the tutorials: ## learnr::run_tutorial("introduction", package = "ggformula") ## learnr::run_tutorial("refining", package = "ggformula") ``` ``` ## Loading required package: mosaicData ``` ``` ## Loading required package: Matrix ``` ``` ## ## Attaching package: 'Matrix' ``` ``` ## The following objects are masked from 'package:tidyr': ## ## expand, pack, unpack ``` ``` ## Registered S3 method overwritten by 'mosaic': ## method from ## fortify.SpatialPolygonsDataFrame ggplot2 ``` ``` ## ## The 'mosaic' package masks several functions from core packages in order to add ## additional features. The original behavior of these functions should not be affected by this. ## ## Note: If you use the Matrix package, be sure to load it BEFORE loading mosaic. ## ## Have you tried the ggformula package for your plots? ``` ``` ## ## Attaching package: 'mosaic' ``` ``` ## The following object is masked from 'package:Matrix': ## ## mean ``` ``` ## The following objects are masked from 'package:dplyr': ## ## count, do, tally ``` ``` ## The following object is masked from 'package:purrr': ## ## cross ``` ``` ## The following object is masked from 'package:ggplot2': ## ## stat ``` ``` ## The following objects are masked from 'package:stats': ## ## binom.test, cor, cor.test, cov, fivenum, IQR, median, prop.test, ## quantile, sd, t.test, var ``` ``` ## The following objects are masked from 'package:base': ## ## max, mean, min, prod, range, sample, sum ``` --- ## Suppressing messages (solution) - Solution: use `message=FALSE` in chunk ```{r, message=FALSE} library(mosaic) ``` ```r library(mosaic) ``` --- ## Overwriting objects of different types - Problem: overwriting object with different type fails on second attempt ```r my_storms <- storms %>% filter(year == 1995) class(my_storms) ``` ``` ## [1] "tbl_df" "tbl" "data.frame" ``` ```r my_storms <- ggplot(my_storms, aes(x = long, y = lat)) + geom_point() ``` --- ## Overwriting objects of different types (cont'd) - Try to run it again... ```r class(my_storms) ``` ``` ## [1] "gg" "ggplot" ``` ```r my_storms <- ggplot(my_storms, aes(x = long, y = lat)) + geom_point() ``` ``` ## Error: `data` must be a data frame, or other object coercible by `fortify()`, not an S3 object with class gg/ggplot ``` --- ## Overwriting objects (solution) - Solution: Give plots a different name ```r my_storm_plot <- ggplot(my_storms, aes(x = long, y = lat)) + geom_point() ``` --- ## Continuous variable supplied to discrete scale - Problem: `wind` is a continuous variable but `Greens` is a discrete palette .pull-left[ ```r ggplot( my_storms, aes( x = long, y = lat, color = wind ) ) + geom_point() + scale_color_brewer( "Greens" ) ``` ``` ## Error: Continuous value supplied to discrete scale ``` ] .pull-right[  ] --- ## Continuous variable supplied to discrete scale - Solution: use `scale_color_distiller()` .pull-left[ ```r ggplot( my_storms, aes( x = long, y = lat, color = wind ) ) + geom_point() + * scale_color_distiller( "Greens" ) ``` ] .pull-right[ 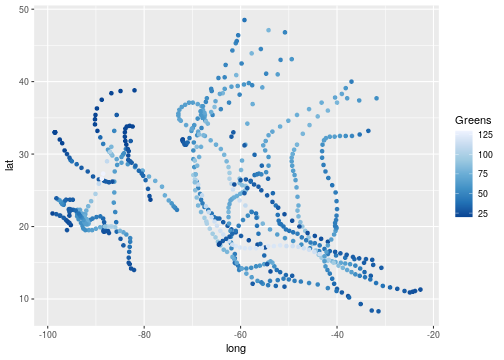 ] --- ## Argument name unspecified - Problem: no error, but always get blue .pull-left[ ```r ggplot( my_storms, aes( x = long, y = lat, color = wind ) ) + geom_point() + scale_color_distiller( "Greens" ) ``` ] .pull-right[ 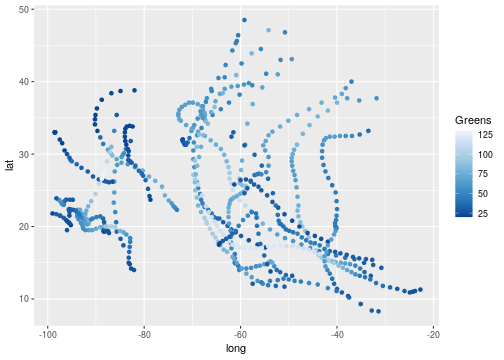 ] --- ## Argument name unspecified - Solution: specify `palette` argument name .pull-left[ ```r ggplot( my_storms, aes( x = long, y = lat, color = wind ) ) + geom_point() + scale_color_distiller( * palette = "Greens" ) ``` ] .pull-right[ 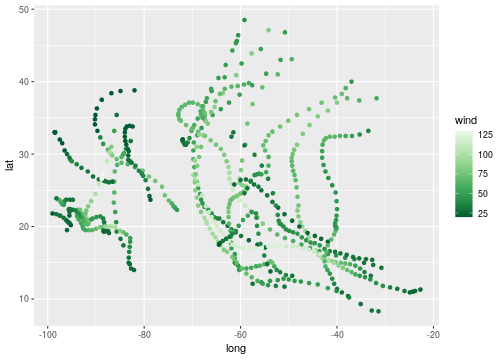 ] --- ## `color` / `fill` mismatch - Problem: legend shows up but colors on plot don't .pull-left[ ```r ggplot( my_storms, aes( x = long, y = lat, fill = wind ) ) + geom_point() + scale_color_distiller( palette = "Greens" ) ``` ] .pull-right[ 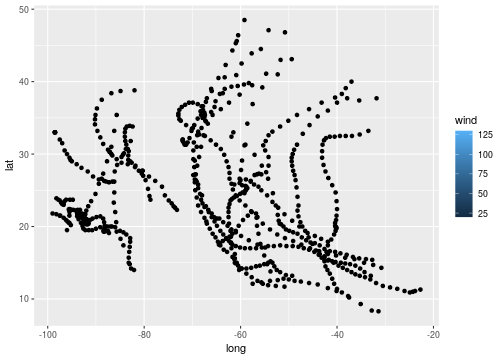 ] --- ## `color` / `fill` mismatch - Solution: set `color` aesthetic instead of `fill` .pull-left[ ```r ggplot( my_storms, aes( x = long, y = lat, * color = wind ) ) + geom_point() + * scale_color_distiller( palette = "Greens" ) ``` ] .pull-right[ 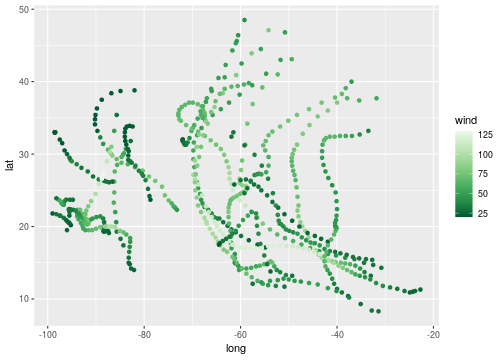 ] --- ## Colors not mapped to variable - Problem: colors don't show up .pull-left[ ```r ggplot( my_storms, aes( x = long, y = lat ), color = wind ) + geom_point() ``` ] .pull-right[ 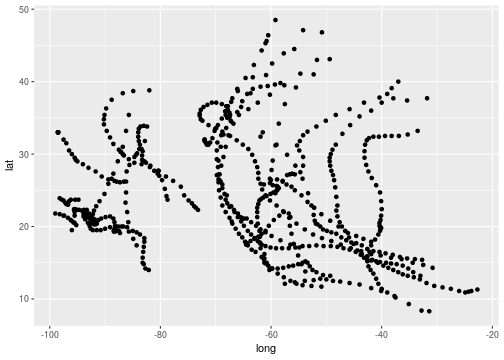 ] --- ## Colors not mapped to variable - Solution: put color mapping inside `aes()` .pull-left[ ```r ggplot( my_storms, aes( x = long, y = lat, * color = wind ) ) + geom_point() ``` ] .pull-right[ 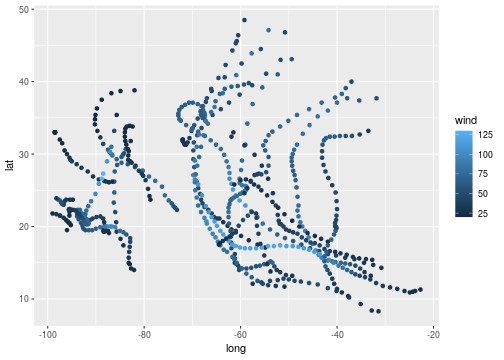 ] --- ## Colors not set to value - Problem: I said `blue` but R put black .pull-left[ ```r ggplot( my_storms, aes( x = long, y = lat ), color = "blue" ) + geom_point() ``` ] .pull-right[ 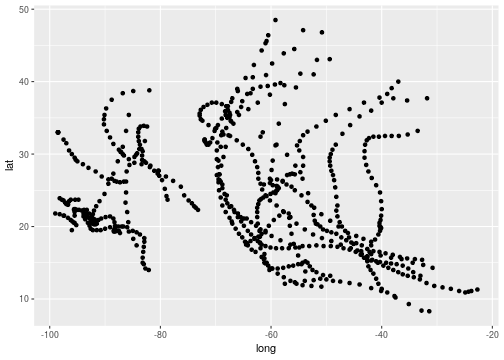 ] --- ## Colors not set to value - Solution: put value inside `geom_*()` .pull-left[ ```r ggplot( my_storms, aes( x = long, y = lat ) ) + * geom_point(color = "blue") ``` ] .pull-right[ 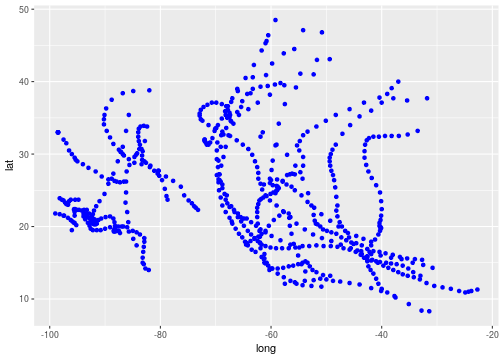 ] --- ## Colors don't vary - Problem: `"wind"` is different than `wind` .pull-left[ ```r ggplot( my_storms, aes( x = long, y = lat, color = "wind" ) ) + geom_point() ``` ] .pull-right[ 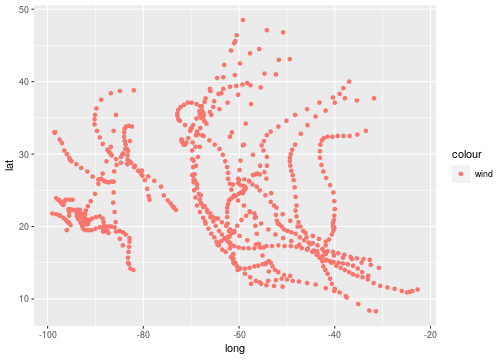 ] --- ## Colors don't vary - Solution: remove quotes .pull-left[ ```r ggplot( my_storms, aes( x = long, y = lat, * color = wind ) ) + geom_point() ``` ] .pull-right[ 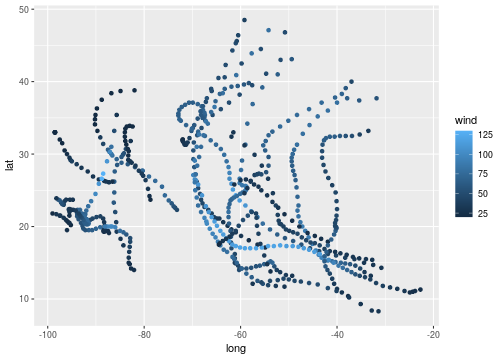 ] --- ## Object not found - Problem: `windspeed` does not exist .pull-left[ ```r ggplot( my_storms, aes( x = long, y = lat, color = windspeed ) ) + geom_point() ``` ``` ## Error in FUN(X[[i]], ...): object 'windspeed' not found ``` ] .pull-right[  ] --- ## Object not found - Solution: spell the name of the variable correctly .pull-left[ ```r ggplot( my_storms, aes( x = long, y = lat, * color = wind ) ) + geom_point() ``` ] .pull-right[ 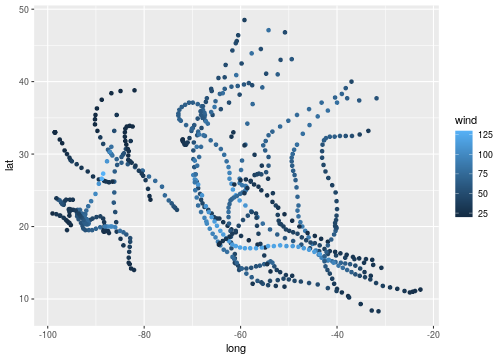 ] ```r names(my_storms) ``` ``` ## [1] "name" "year" "month" "day" "hour" ## [6] "lat" "long" "status" "category" "wind" ## [11] "pressure" "ts_diameter" "hu_diameter" ``` --- ## Cannot add ggproto object together - Problem: `+` operator has to be at end of line .pull-left[ ```r ggplot( my_storms, aes( x = long, y = lat, color = wind ) ) ``` ```r + geom_point() ``` ``` ## Error: Cannot use `+.gg()` with a single argument. Did you accidentally put + on a new line? ``` ] --- ## Cannot add ggproto object together - Solution: move `+` operator to end of line .pull-left[ ```r ggplot( my_storms, aes( x = long, y = lat, color = wind ) *) + geom_point() ``` ] .pull-right[ 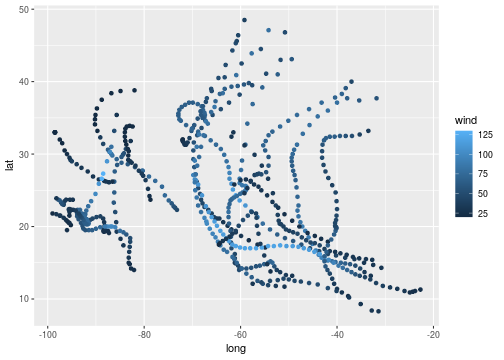 ] --- ## Unexpected SPECIAL - Problem: pipe operator has to be at end of line ```r my_storms <- storms %>% filter(year == 1995) ``` ``` ## Error: <text>:2:3: unexpected SPECIAL ## 1: my_storms <- storms ## 2: %>% ## ^ ``` --- ## Unexpected SPECIAL - Solution: move pipe operator to end of line ```r my_storms <- storms %>% filter(year == 1995) ```