# A tibble: 2 × 3
quarantine num_responses pct
<fct> <int> <dbl>
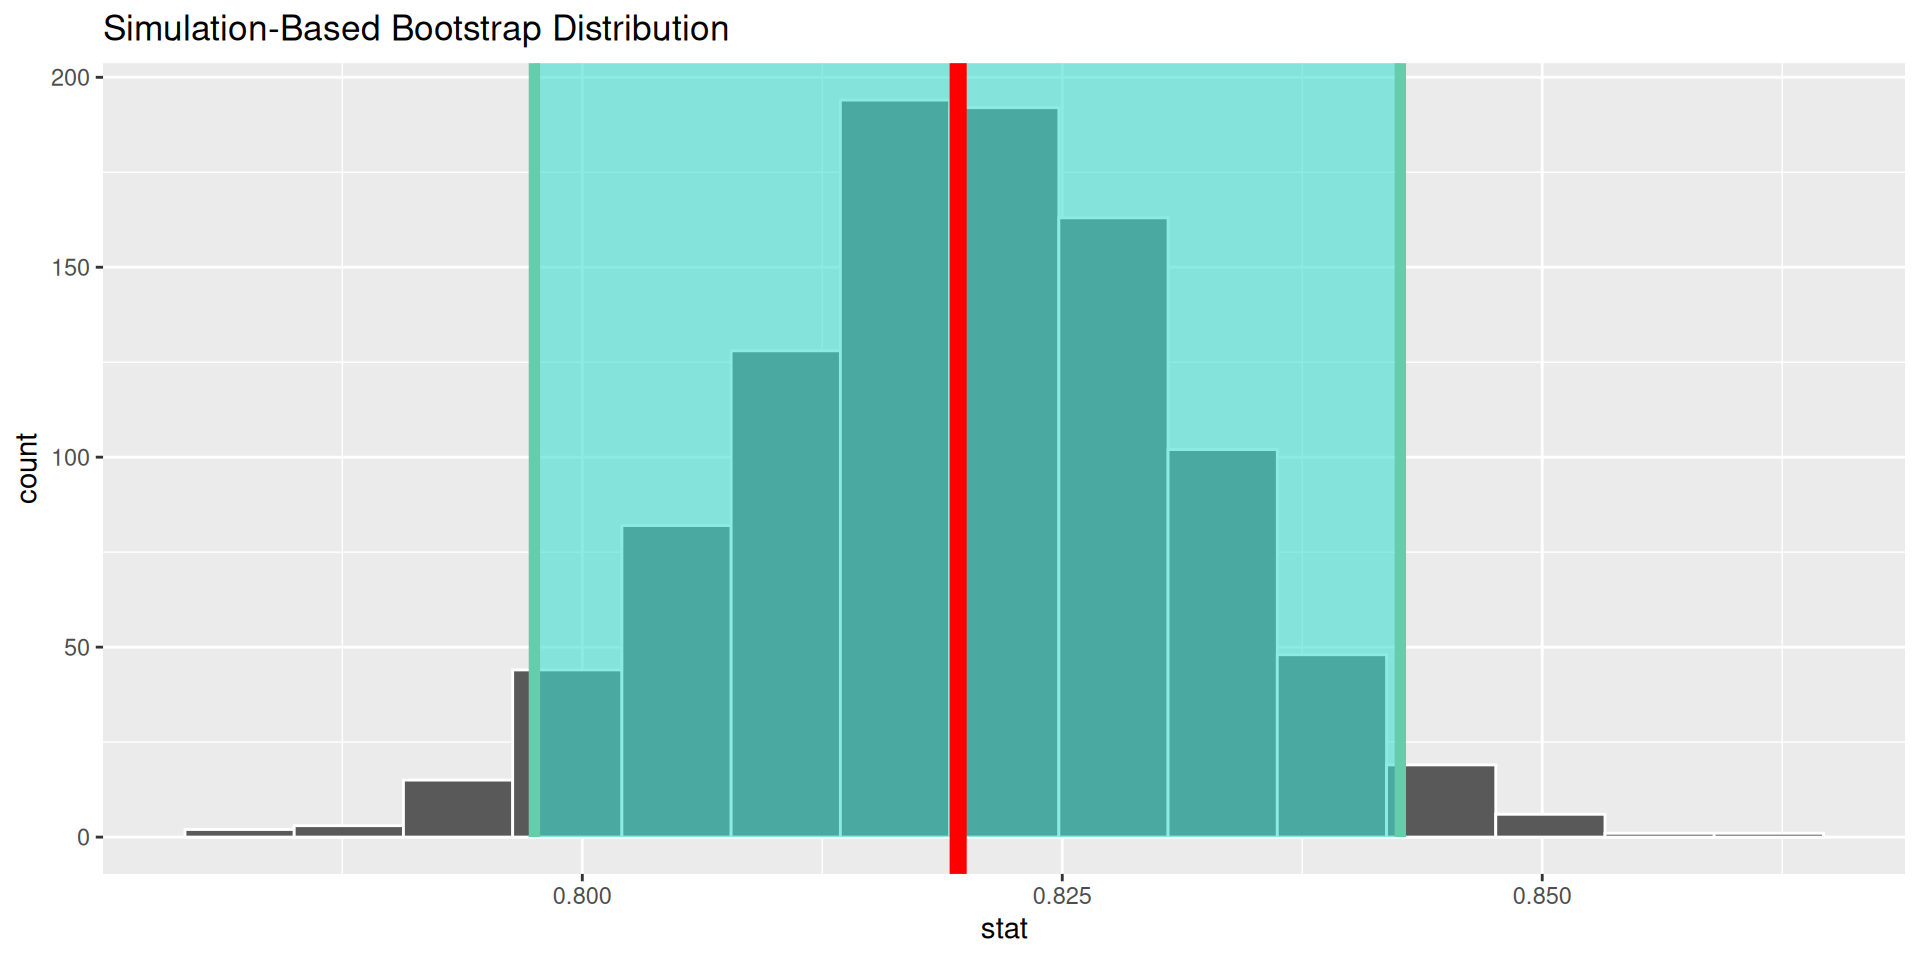
1 against 188 0.180
2 favor 854 0.820Parametric Bootstrap
IMS, Ch. 16.1
Mar 22, 2026
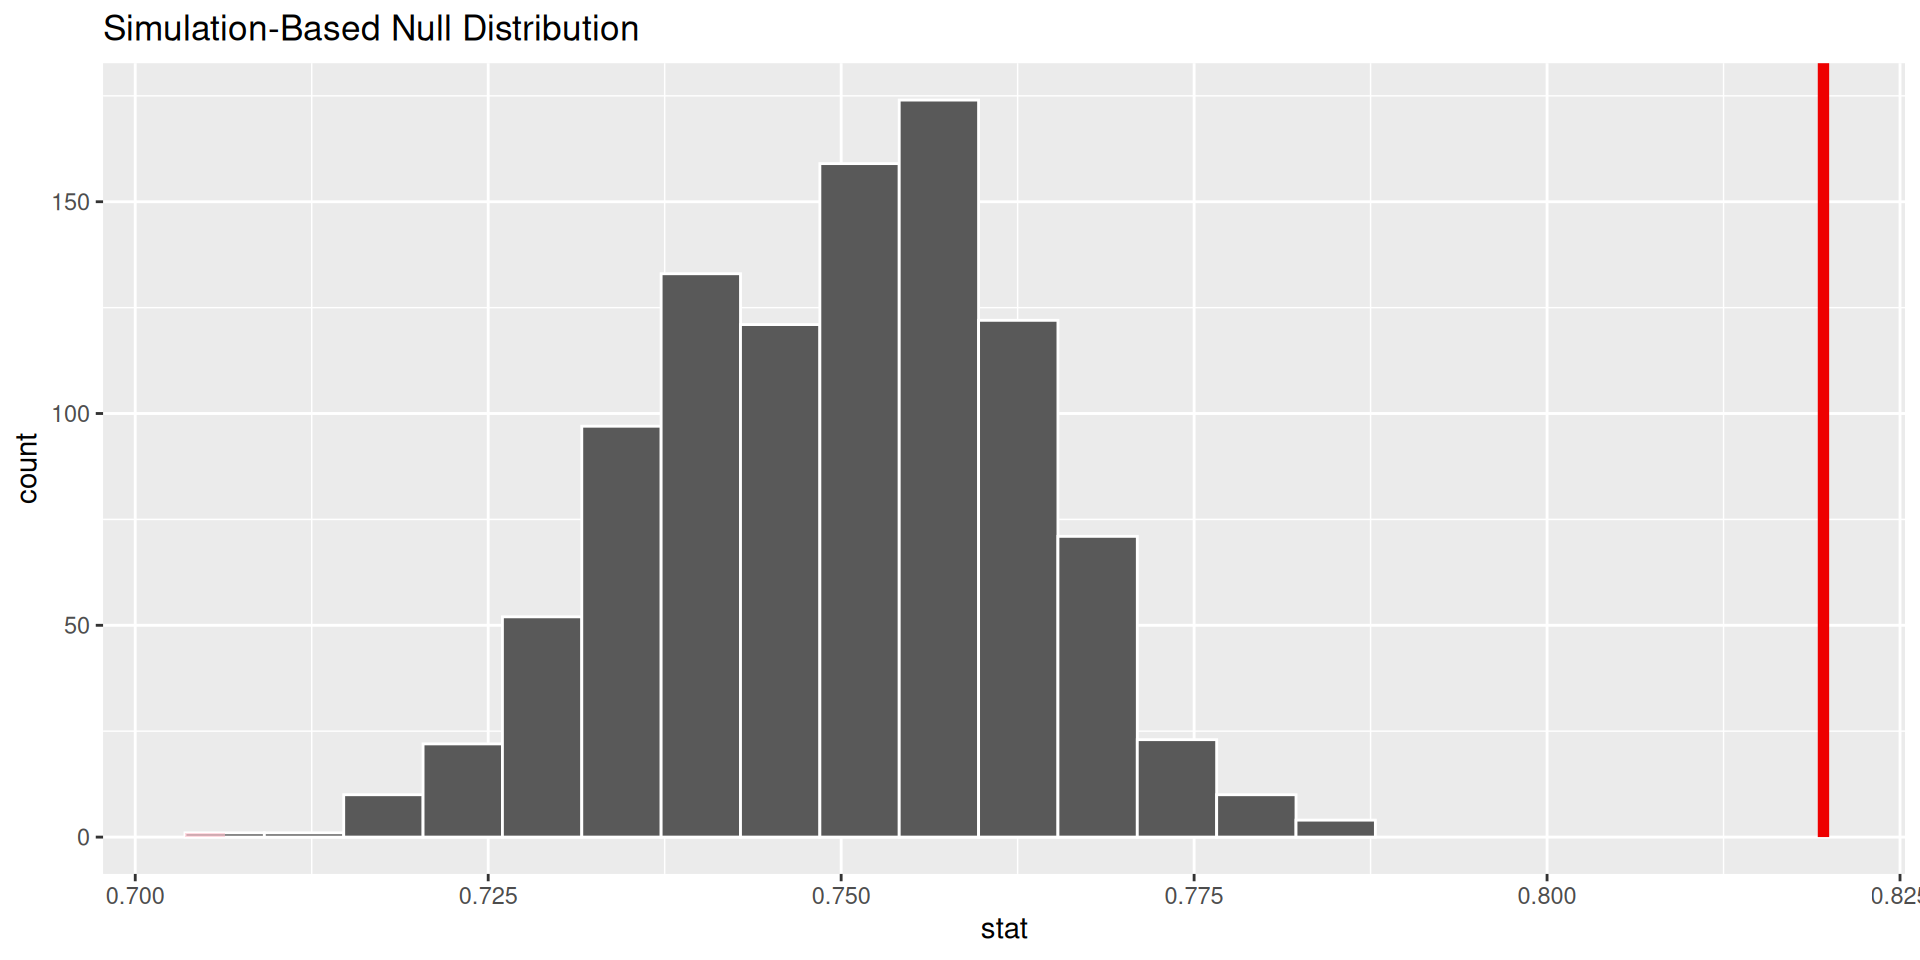
The sampling distribution of \(\hat{p}\)
IMS, Ch. 16.1
Mar 22, 2026