     ideology  No Not sure Yes Total
 Conservative 151       35 186   372
      Liberal  52        9 114   175
     Moderate 161       28 174   363
Total 364 72 474 910Inference for two-way tables
IMS, Ch. 18
Apr 10, 2026
R.A. Fisher

“a genius who almost single-handedly created the foundations for modern statistical science”
“the single most important figure in 20th century statistics”
a racist, eugenicist, and Nazi sympathizer
renaming of COPSS Award
How Eugenics Shaped Statistics
Statistical thinking and eugenicist thinking are, in fact, deeply intertwined, and many of the theoretical problems with methods like significance testing—first developed to identify racial differences—are remnants of their original purpose, to support eugenics.

- see also Kennedy-Shaffer (2024)
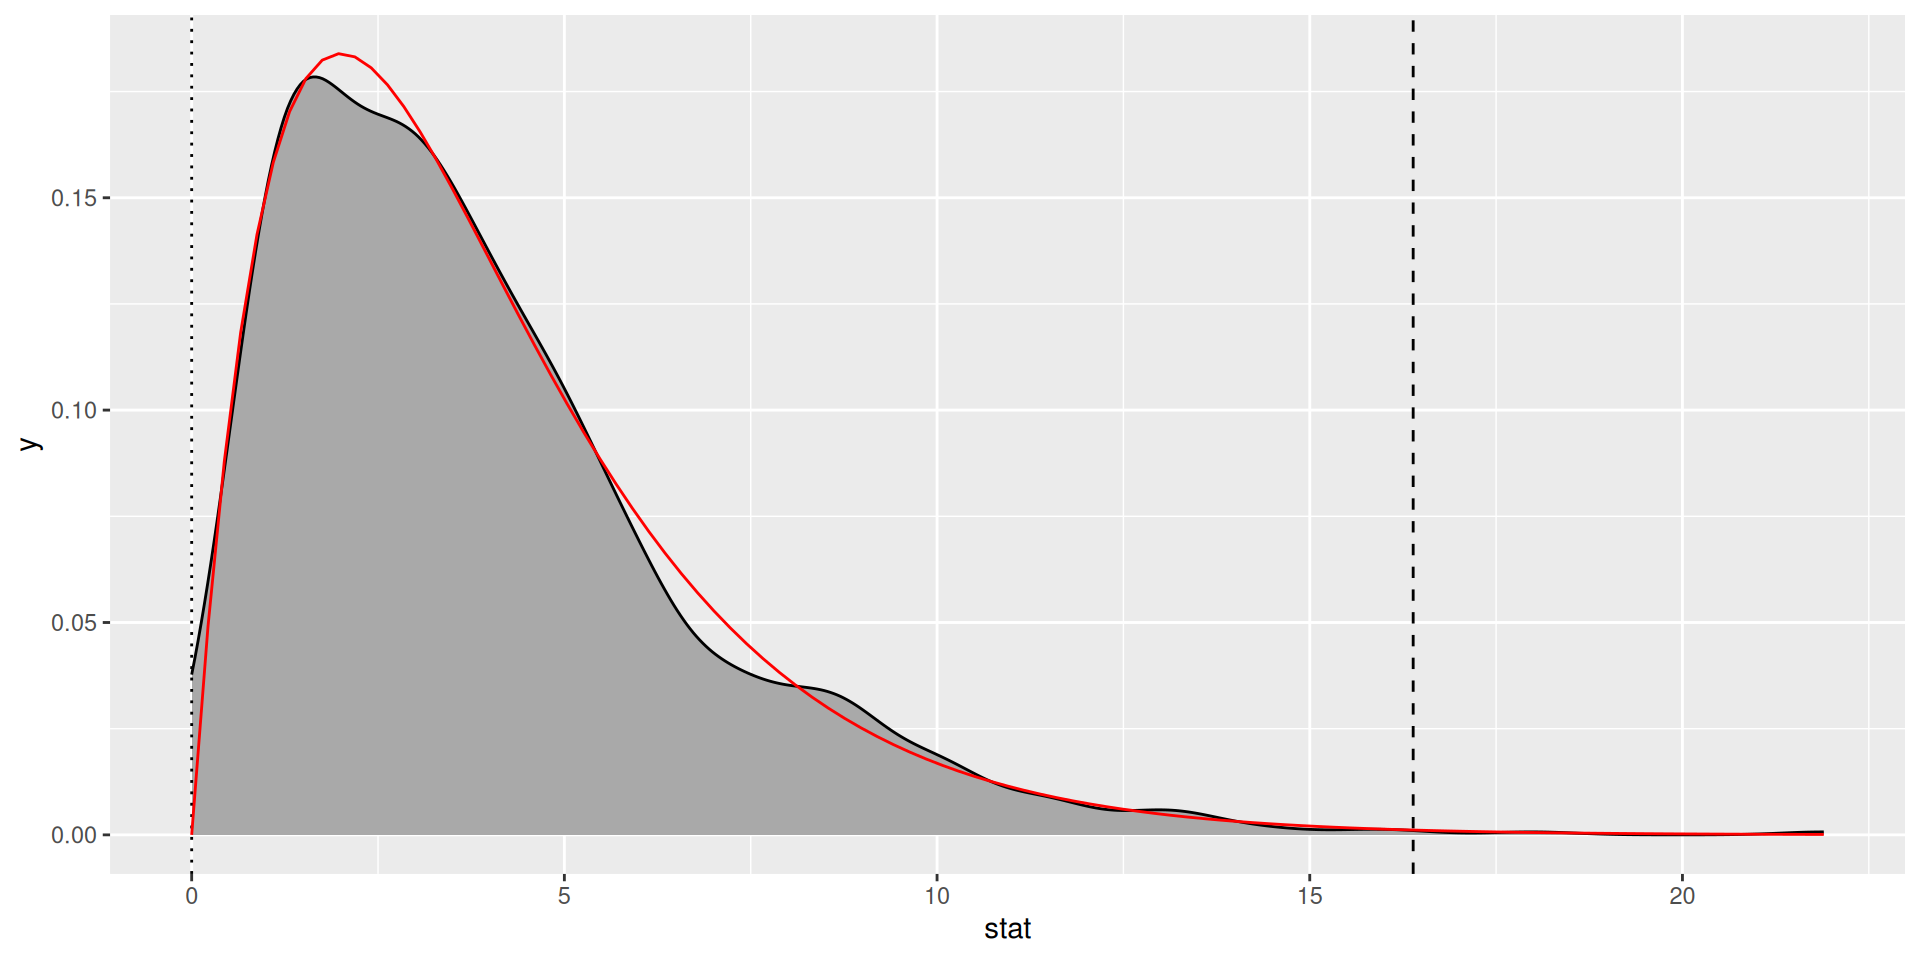
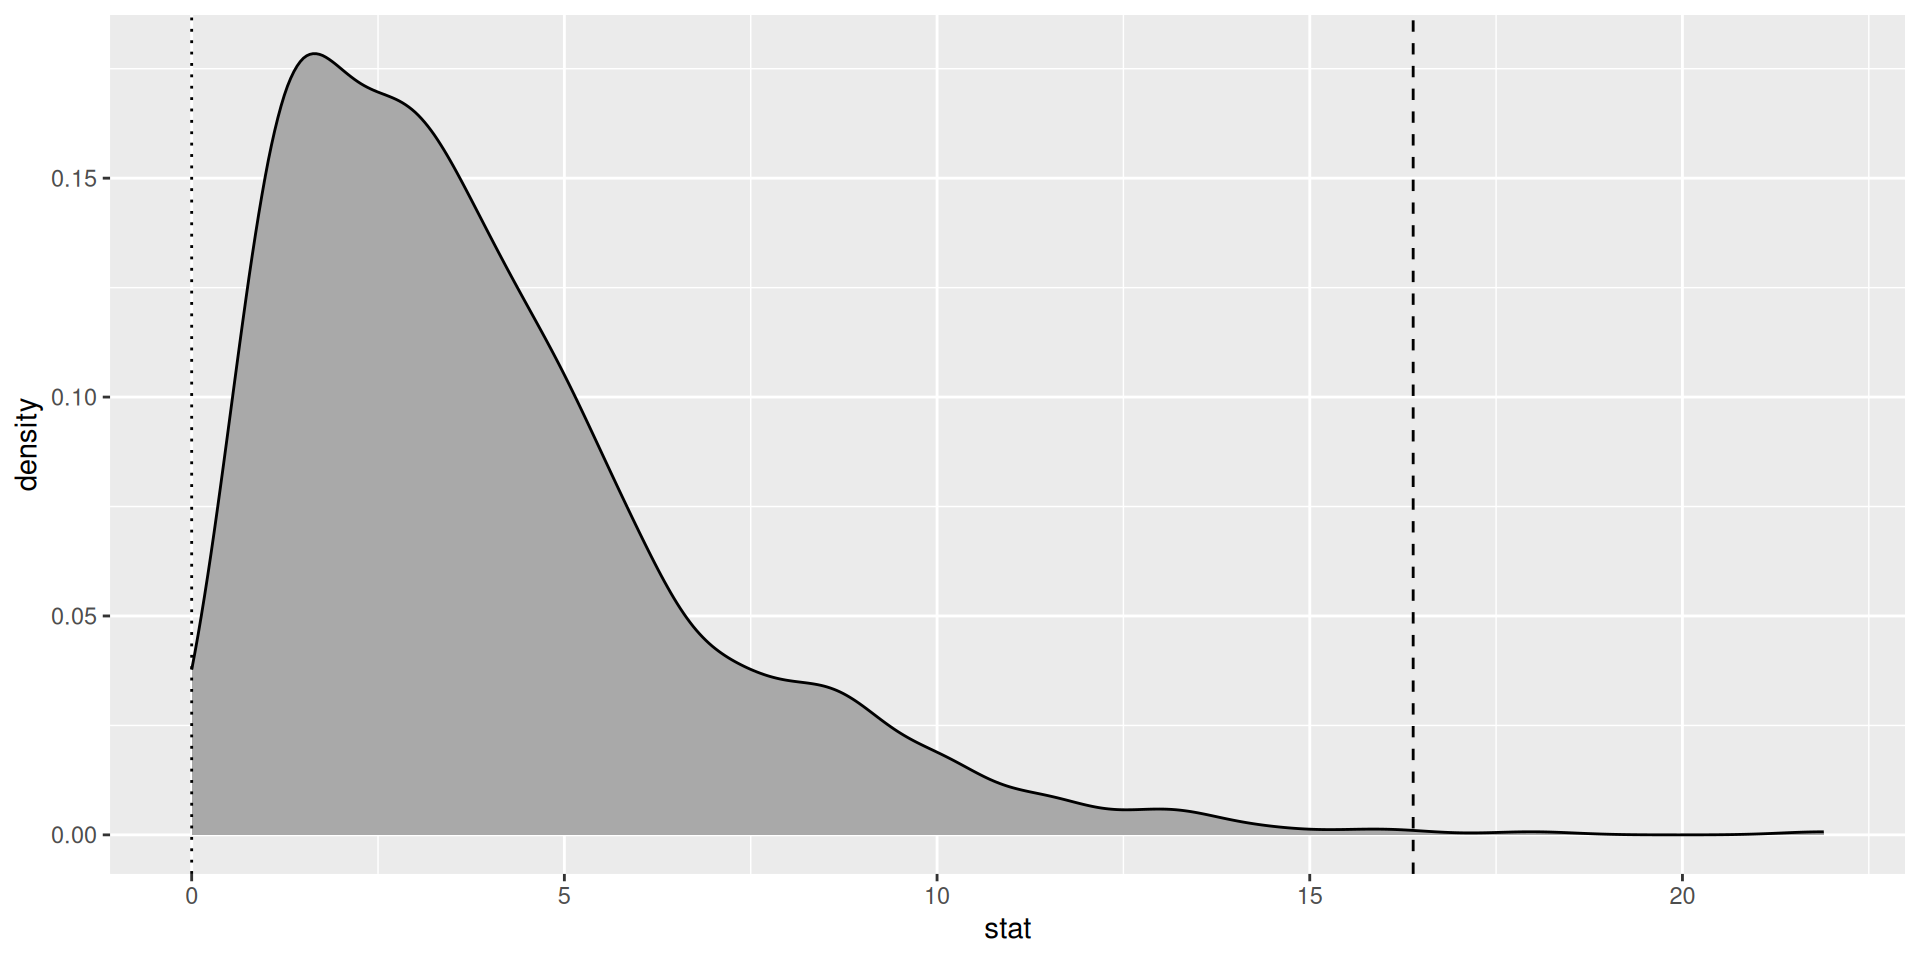
Permutation test
Null approximation