[1] 28As of the end of the 2024-2025 school year, Massachusetts’ chronic absenteeism rate has fallen to 18.8 percent, a nearly 6 percentage point decrease from March 2023, a decline possibly prompted by a statewide initiative tackling absenteeism (Massachusetts Education-to-Career Research & Data Hub 2024). However, this figure remains above pre-pandemic levels.
As part of Governor Maura Healey’s 2024 “Your Presence Is Powerful” campaign, a $4 million statewide effort, the Massachusetts Department of Elementary and Secondary Education (DESE) allocated targeted funding to districts with high absenteeism rates and supported initiatives to increase attendance (Healey-Driscoll Administration Launches “Your Presence Is Powerful” Campaign to Raise Awareness of Importance of School Attendance 2024). The department invited students, educators, and families in all districts to submit creative work expressing why they value regular attendance, according to an August 2024 press release from the Executive Office of Education (MassInsider 2024) The campaign also included multilingual public service announcements on television, social media, and billboards highlighting why showing up to school matters.
Missing ten percent of the school year, or about two days a month, is enough for a Massachusetts student to be classified as chronically absent (U.S. Department of Education n.d.). In recent years, tens of thousands of students across the state have met this threshold.
Chronic absenteeism increased sharply during the COVID-19 pandemic and remained elevated even after schools fully reopened. Before the pandemic, 13 percent of Massachusetts students were classified as chronically absent, according to Massachusetts DESE data (Massachusetts Education-to-Career Research & Data Hub 2024). By March 2023, that figure rose to 24.5 percent.
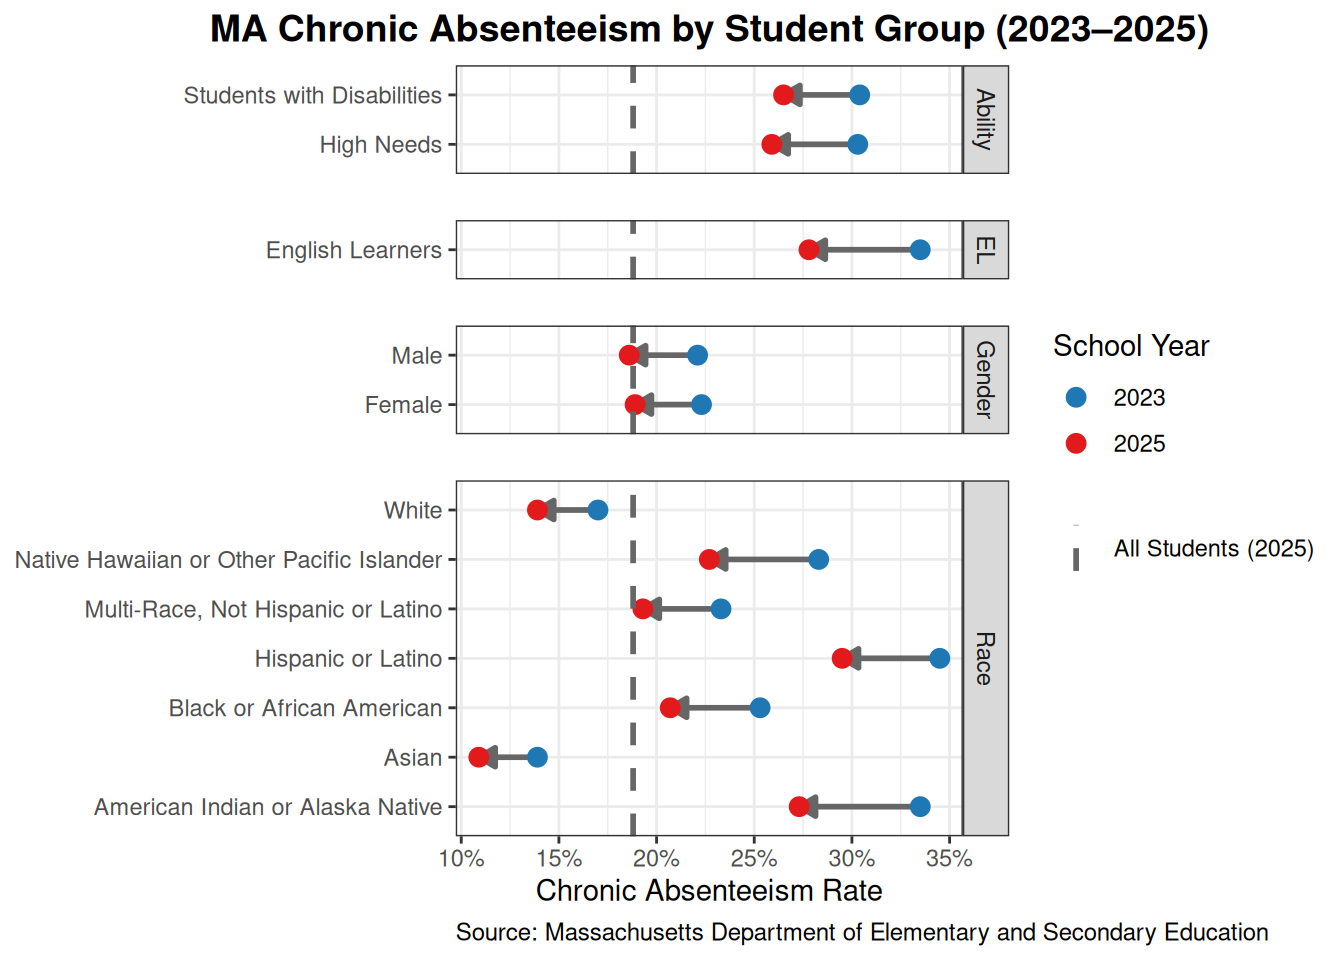
Chronic absenteeism also varies widely across student groups, with Hispanic or Latino students, English learners, and students with disabilities experiencing disproportionately high rates. This reinforces research showing that absenteeism is closely connected to broader resource disparities (Opara et al. 2022).
Gavin, a junior at a Massachusetts public high school managing a chronic illness whose first name only is given due to his being a minor, represents students with disabilities who often face unique barriers to attendance. He describes how even routine school days can be challenging.
“When I have to go to school to keep up my attendance but I’m in a flare, it’s hard, cause I’m in pain and I can’t concentrate. Sometimes I just can’t go.”
Gavin’s story underscores the challenges faced by many students across Massachusetts. To better understand the scope of chronic absenteeism and the impact of the 2024 “Your Presence Is Powerful” campaign, the figure below shows statewide chronic absenteeism rates for 2023 and 2025, broken down by student subgroup, using data from the Massachusetts DESE. The dashed line represents the 2025 student average.
Code
subgroups_wideCode
library(ggplot2)
library(grid)
library(scales)
library(tidyr)

points_long <- subgroups_wide |>
  pivot_longer(
    cols = c(`2023`, `2025`),
    names_to = "year",
    values_to = "pct_chron_abs_10"
  )

# Reference line for 2025 All Students average
reference_line <- data.frame(
  x = all_students_wide$`2025`,
  label = "All Students (2025)"
)

ggplot() +

  # Arrows showing change
  geom_segment(
    data = subgroups_wide,
    aes(
      x = `2023`,
      xend = `2025`,
      y = stu_grp,
      yend = stu_grp
    ),
    arrow = arrow(type = "closed", length = unit(0.25, "cm")),
    color = "gray40",
    linewidth = 1
  ) +

  # Points for each year
  geom_point(
    data = points_long,
    aes(x = pct_chron_abs_10, y = stu_grp, color = year),
    size = 3
  ) +

  # Vertical dashed line for 2025 All Students
  geom_vline(
    data = reference_line,
    aes(xintercept = x, linetype = label),
    color = "gray40",
    linewidth = 1
  ) +

  # Facets by category
  facet_grid(
    category ~ .,
    scales = "free_y",
    space = "free_y",
    labeller = labeller(
      category = c(
        "Disability / High Needs" = "Ability",
        "English Learners" = "EL"
      )
    )
  ) +

  # Full title and caption
  ggtitle("MA Chronic Absenteeism by Student Group (2023–2025)") +
  labs(
    x = "Chronic Absenteeism Rate",
    y = NULL,
    color = "School Year",
    linetype = NULL,
    caption = "Source: Massachusetts Department of Elementary and Secondary Education"
  ) +

  # Colors and line type
  scale_color_manual(
    values = c("2023" = "#1f78b4", "2025" = "#e31a1c")
  ) +
  scale_linetype_manual(
    values = c("All Students (2025)" = "dashed")
  ) +

  # X-axis as percentages
  scale_x_continuous(
    labels = percent_format(accuracy = 1)
  ) +

  # Theme
  theme_bw() +
  theme(
    strip.placement = "outside",
    strip.text.y = element_text(size = 9),
    panel.spacing = unit(1.2, "lines"),
    plot.title = element_text(size = 14, face = "bold", hjust = 0.5),
    plot.caption = element_text(size = 9, hjust = 0)
  )
Code
ggsave(
  filename = "/Users/maddyallred/Downloads/absenteeism_plot.png",
  plot = last_plot(),
  width = 12,
  height = 6,
  units = "in",
  dpi = 300
)
In 2023 and 2025 alike, Hispanic or Latino students recorded the highest rates of chronic absenteeism, falling from roughly 35 percent in 2023 to just under 30 percent in 2025. American Indian or Alaska Native students also experienced persistently high rates, alongside English learners and students with disabilities, while Asian and White students recorded the lowest rates.
Although absenteeism declined across every subgroup, the relative ordering of groups changed little. Hispanic or Latino students, English learners, and American Indian or Alaska Native students experienced some of the largest declines, each falling by roughly five to six percentage points between 2023 and 2025 — a steeper drop than that of White and Asian students. However, even substantial declines were not enough to close gaps that remain in the double digits between the highest- and lowest-absenteeism groups.
While state initiatives have been successful in reducing absenteeism overall, the data show that students who faced the highest rates in 2023 remain among the most affected in 2025. For some students, efforts to curb absenteeism have also come with stricter attendance policies at the school level (The Patriot Ledger 2025).
Gavin reports that over the past several years, attendance rules at his high school have become increasingly rigid. Students lose a class credit if they accumulate six absences in a single class during one quarter.
“Imagine I had a really bad flare and had to miss six days of school; I would still lose a credit,” he explained. “It penalizes people who actually have to miss school.”
For students like Gavin, progress in state attendance rates doesn’t always translate to improved well-being. Chronic absenteeism rates reflect inequities in resources, health, and opportunity. Massachusetts’ recent improvements are encouraging, but the data show that the work is far from over.
References
Healey-Driscoll Administration Launches “Your Presence Is Powerful” Campaign to Raise Awareness of Importance of School Attendance. 2024. Massachusetts Executive Office of Education. https://www.mass.gov/news/healey-driscoll-administration-launches-your-presence-is-powerful-campaign-to-raise-awareness-of-importance-of-school-attendance.
Massachusetts Education-to-Career Research & Data Hub. 2024. Reducing Chronic Absenteeism in Our Schools. Massachusetts Executive Office of Education. https://educationtocareer.data.mass.gov/stories/s/Reducing-chronic-absenteeism-in-our-schools/vuut-f46x/.
MassInsider. 2024. Massachusetts Launches Campaign Highlighting the Importance of School Attendance. MassInsider. https://massinsider.net/press-releases/38867.
Opara, Ijeoma, Daneele Thorpe, and David T. Lardier Jr. 2022. “School Absenteeism and Neighborhood Deprivation and Threat: Utilizing the Child Opportunity Index to Assess for Neighborhood-Level Disparities in Passaic County, NJ.” Urban Education 59 (9): 2738–66. https://doi.org/10.1177/00420859221125704.
The Patriot Ledger. 2025. Quincy Public Schools Revise Attendance Policy to Reduce Chronic Absenteeism. https://www.patriotledger.com/story/news/education/2025/10/03/quincy-public-schools-ma-high-schools-north-policy-chronic-absenteeism-skip/84007400007/.
U.S. Department of Education. n.d. Chronic Absenteeism. U.S. Department of Education. https://www.ed.gov/teaching-and-administration/supporting-students/chronic-absenteeism.