Are the last few supporters of the MCAS right? Should the test make a comeback?
The MCAS, or Massachusetts Comprehensive Assessment System, was a result of the 1993 Education Reform Law which created a formula to determine funding of schools across Massachusetts, with the goal of equalizing students’ access to an education as stated in a 2003 report by Umass Amherst School of Education. The focus on these assessments has led to students feeling their schools were focusing on standardized testing as their north star.
“I wasn’t allowed to miss MCAS prep to participate in other school activities that I wanted to… there was always this expectation to do well on the test, I just wanted to get it over with,” said Sophia Rubin, a student in eastern mass. about her experience with the MCAS in elementary and middle school.
Spending in so many schools across Massachusetts became tied to testing scores, but students benefit from spending not directly attached to their academics and test scores, as reported by Jie Chen and Thomas Ferguson in School District Performance Under the MCAS.
“The MCAS are not a really accurate indicator of who’s using school resources especially because social emotional learning is a huge factor in every student’s day to day … cutting those resources affects everyone detrimentally” - Kate Whiner, a student teacher in local Northampton schools, told us. She went on to say that “bad” test takers, who are often the students who need non-educational resources the most, are commonly discouraged from taking the tests over the fear that the school and district’s average test scores would be hurt.
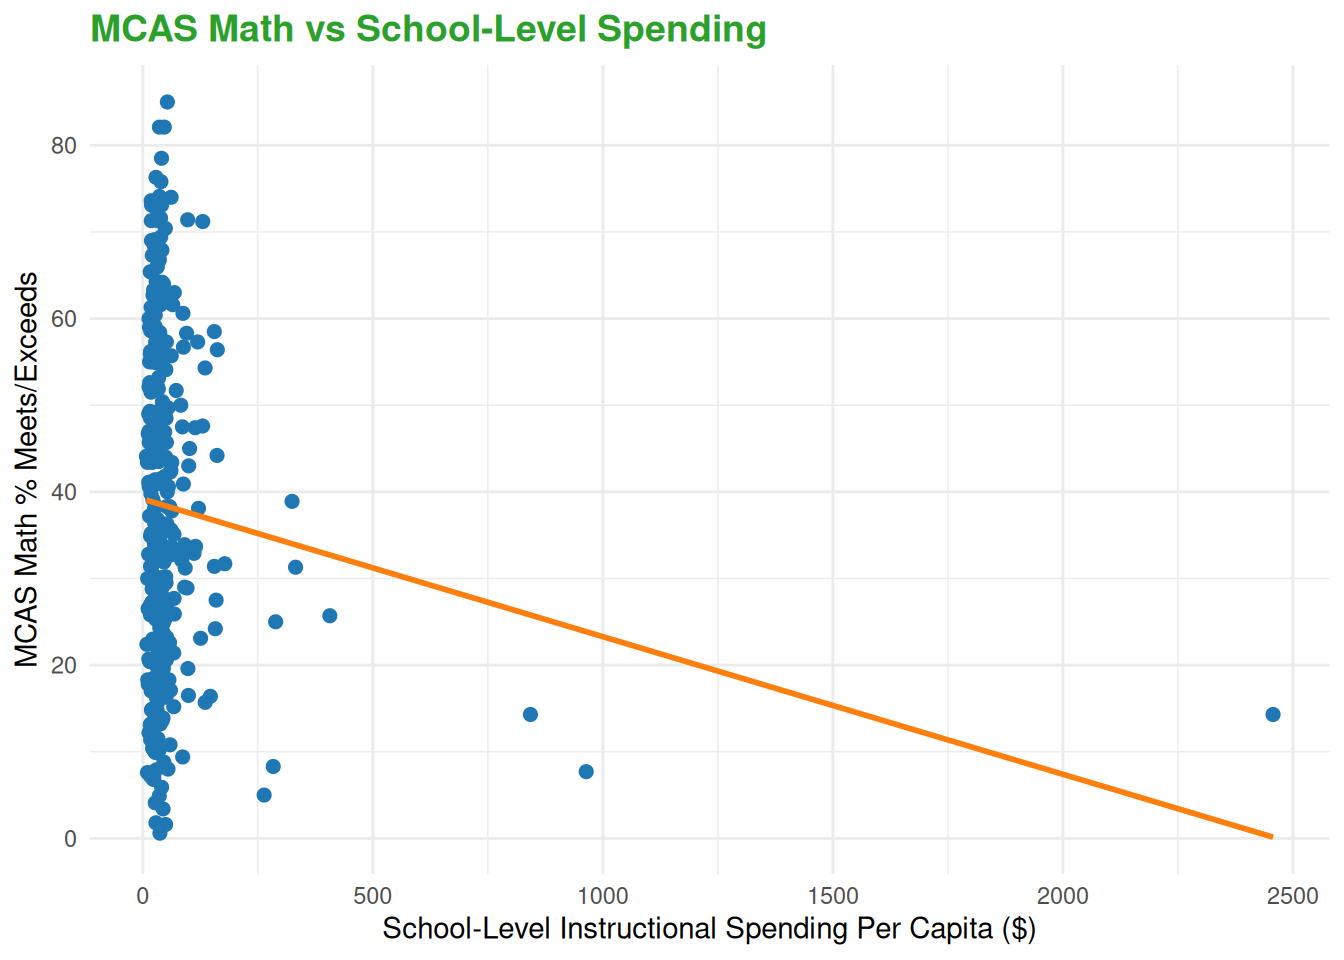
Each dollar spent in school-level instructional spending per capita is associated with a 0.09476 percentage increase in the percentage of students in grades 3 to 8 that met or exceeds expectations on the MCAS Math examination, holding all other spending constant.
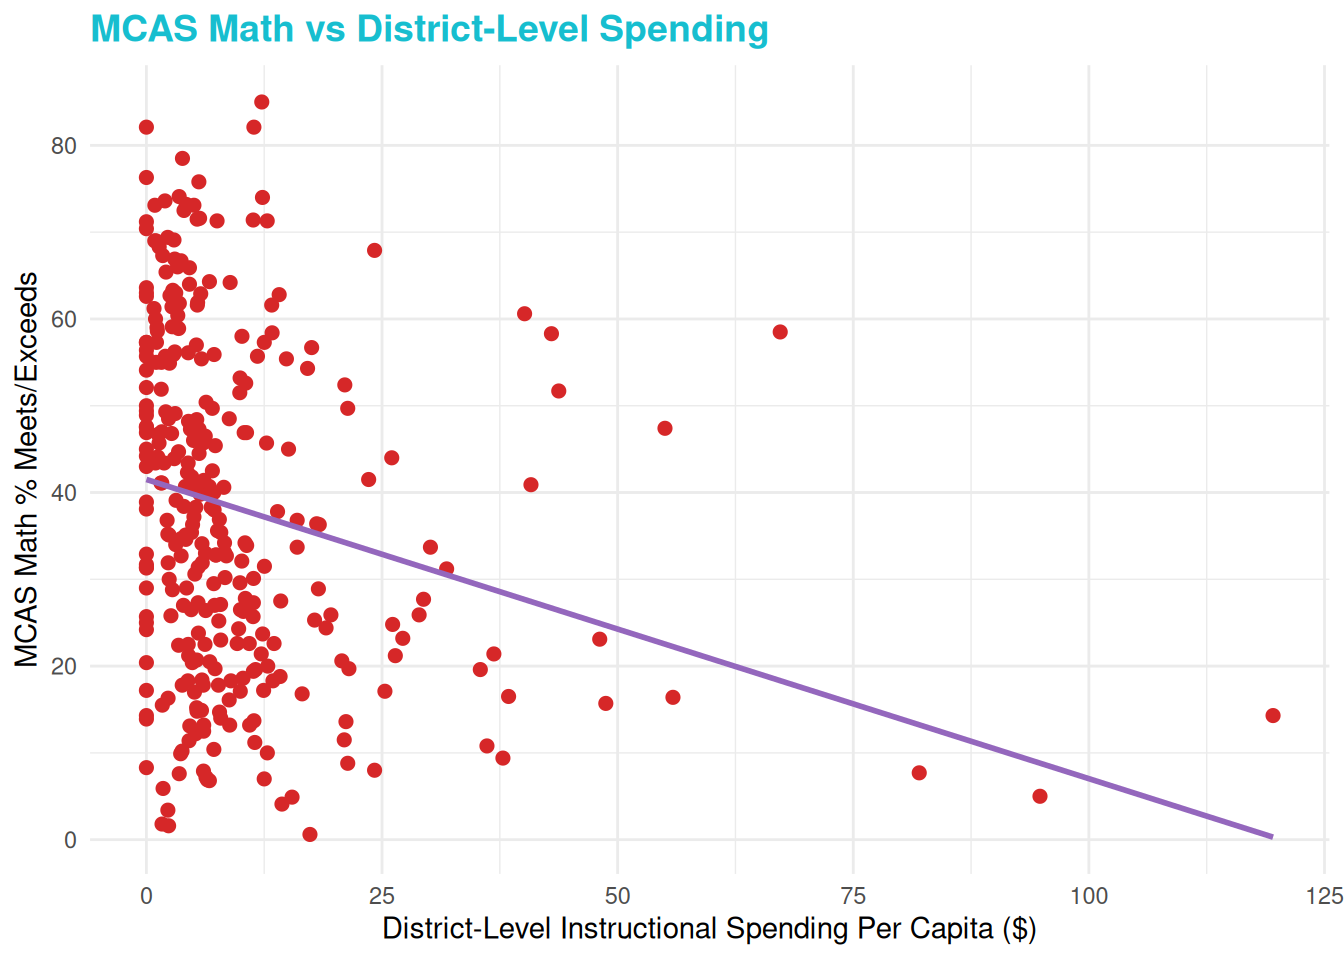
Each dollar spent in distinct level instructional expenditures per capita is associated with a 3.56722 percentage decrease in the percentage of students in grades 3 to 8 that met or exceeds expectations on the MCAS Math examinations, holding all other spending constant.
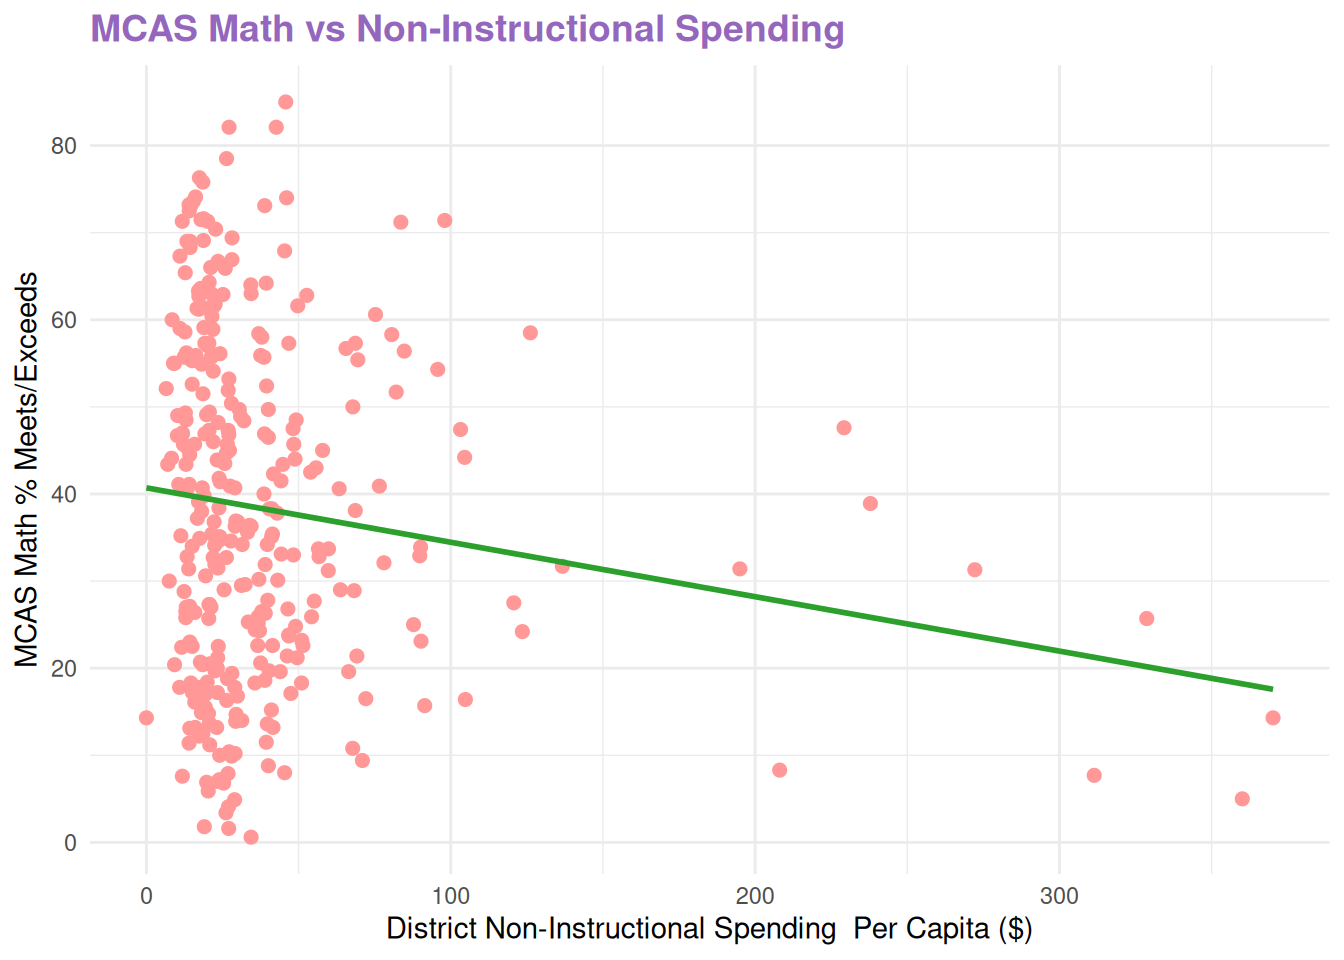
Each dollar spent in District Non-Instructional Expenditures per capita is associated with a 1.86728 percentage decrease in the percentage of students in grades 3 to 8 that met or exceeded expectations on the MCAS Math examinations, holding all other spending constant.
Questions of wither or not the pass rate is impacted by retakes (thus making it lower)
Are the last few supporters of the MCAS right? Should the test make a comeback?
The MCAS, or Massachusetts Comprehensive Assessment System, was a result of the 1993 Education Reform Law which created a formula to determine funding of schools across Massachusetts, with the goal of equalizing students’ access to an education as stated in a 2003 report by Umass Amherst School of Education. The focus on these assessments has led to students feeling their schools were focusing on standardized testing as their north star.
“I wasn’t allowed to miss MCAS prep to participate in other school activities that I wanted to… there was always this expectation to do well on the test, I just wanted to get it over with,” said Sophia Rubin, a student in eastern mass. about her experience with the MCAS in elementary and middle school.
Spending in so many schools across Massachusetts became tied to testing scores, but students benefit from spending not directly attached to their academics and test scores, as reported by Jie Chen and Thomas Ferguson in School District Performance Under the MCAS.
“The MCAS are not a really accurate indicator of who’s using school resources especially because social emotional learning is a huge factor in every student’s day to day … cutting those resources affects everyone detrimentally,” said Kate Whiner, a student teacher in local Northampton schools. She added that “bad” test takers, who are often the students who need non-educational resources the most, are commonly discouraged from taking the tests over the fear that the school and district’s average test scores would be hurt.
Plot
Code
library(ggplot2)# Scatterplot: School-Level Instructional Spendingggplot(analysis_df, aes(x =`School-Reported Instructional Expenditures PC`,y =`Math Grades 3-8 % Meets or Exceeds`)) +geom_point(color ="#1f77b4", size =2) +# blue pointsgeom_smooth(method ="lm", se =FALSE, color ="#ff7f0e") +# orange linelabs(x ="School-Level Instructional Spending Per Capita ($)",y ="MCAS Math % Meets/Exceeds",title ="MCAS Math vs School-Level Spending" ) +theme_minimal() +theme(plot.title =element_text(color ="#2ca02c", size =14, face ="bold"))
Code
# Scatterplot: District-Level Instructional Spendingggplot(analysis_df, aes(x =`District-Level Instructional Expenditures PC`,y =`Math Grades 3-8 % Meets or Exceeds`)) +geom_point(color ="#d62728", size =2) +# red pointsgeom_smooth(method ="lm", se =FALSE, color ="#9467bd") +# purple linelabs(x ="District-Level Instructional Spending Per Capita ($)",y ="MCAS Math % Meets/Exceeds",title ="MCAS Math vs District-Level Spending" ) +theme_minimal() +theme(plot.title =element_text(color ="#17becf", size =14, face ="bold"))
Code
# Scatterplot: District Non-Instructional Spendingggplot(analysis_df, aes(x =`District Non-Instructional Expenditures PC`,y =`Math Grades 3-8 % Meets or Exceeds`)) +geom_point(color ="#ff9896", size =2) +# pink pointsgeom_smooth(method ="lm", se =FALSE, color ="#2ca02c") +# green linelabs(x ="District Non-Instructional Spending Per Capita ($)",y ="MCAS Math % Meets/Exceeds",title ="MCAS Math vs Non-Instructional Spending" ) +theme_minimal() +theme(plot.title =element_text(color ="#9467bd", size =14, face ="bold"))
An examination of school spending divided in district educational, district non-educational and school educational along with MCAS proficiency for middle schoolers paints a picture of this non-instruction spending seemingly having a nearly nonexistent effect on students, when in reality this can be some of the most important assets to a student’s development. While success on this test does not directly equate to additional funding the state does use the average score as a metric for how well a school is spending its funding. If “non-education spending” has the least impact on student performance on the MCAS , in such a strictly numbers focused world it is most likely to be cut.
There is still value in creating a standardized testing system to prevent students from graduating without retaining valuable information from their schooling, but the voters of Massachusetts have spoken. The MCAS is no more. Instead the state is moving towards specific course requirements and possible capstone projects, but some of the details are still in the works.
“[Students] can focus on what they’re learning in the classroom and bring it to their community through their capstone project. They can apply what they’re learning in real life, you need that extra step in the real world,” said Rubin.
Citations (MLA): Berger, Joseph, et al. An Overview of Massachusetts Education Reform Impact of the Education Reform Act on Equalizing Education Finance Linda Driscoll Bridges and Barriers: Equity Issues in High Stakes Testing Setting Passing Scores on Tests Ronald K. Hambleton Are MCAS Scores Comparable over Time? VRROOM: The Virtual Reference Room Managing to Lead in the Decade of Education Reform Capacity to Implement Education Reform Conclusions: The Impact of Education Reform after Ten Years.
Chen, Jie and Ferguson, Thomas (2002) “School District Performance Under the MCAS,” New England Journal of Public Policy: Vol. 17: Iss. 2, Article 7.