06-Assessing Conditions
SDS 291
September 24, 2025
Independence 😄
- Depends on how the data were collected
When does independence usually hold?
- Data collected by a random sample
Independence 😄
Common violations of independence
- Time series/longitudinal data: same observational units are measured repeatedly over time
- Ex: tracking stock market returns over time
- Clustered data: observational units are physically grouped (e.g., by geography, by family relationship) into “clusters” that tend to be more alike
- Ex: collecting information on birth weight from sets of siblings
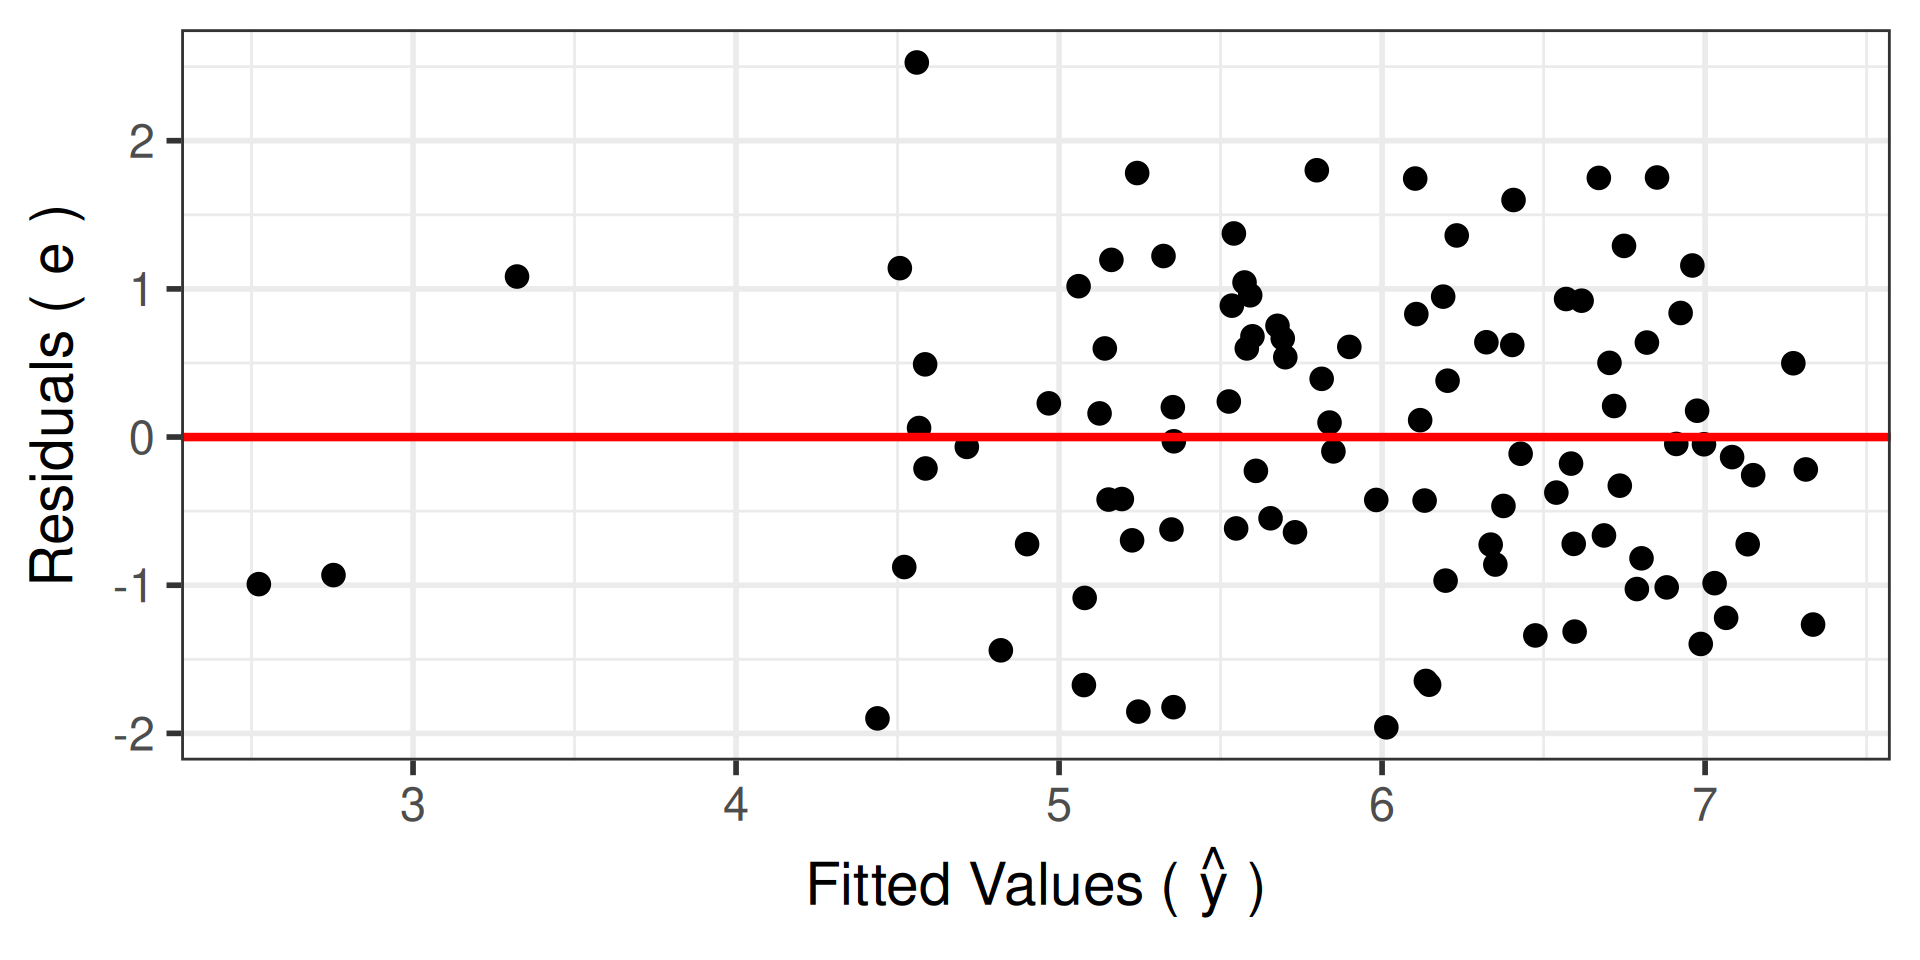
Linearity: 😄
Random scatter above and below the reference \(y = 0\) line
![]()
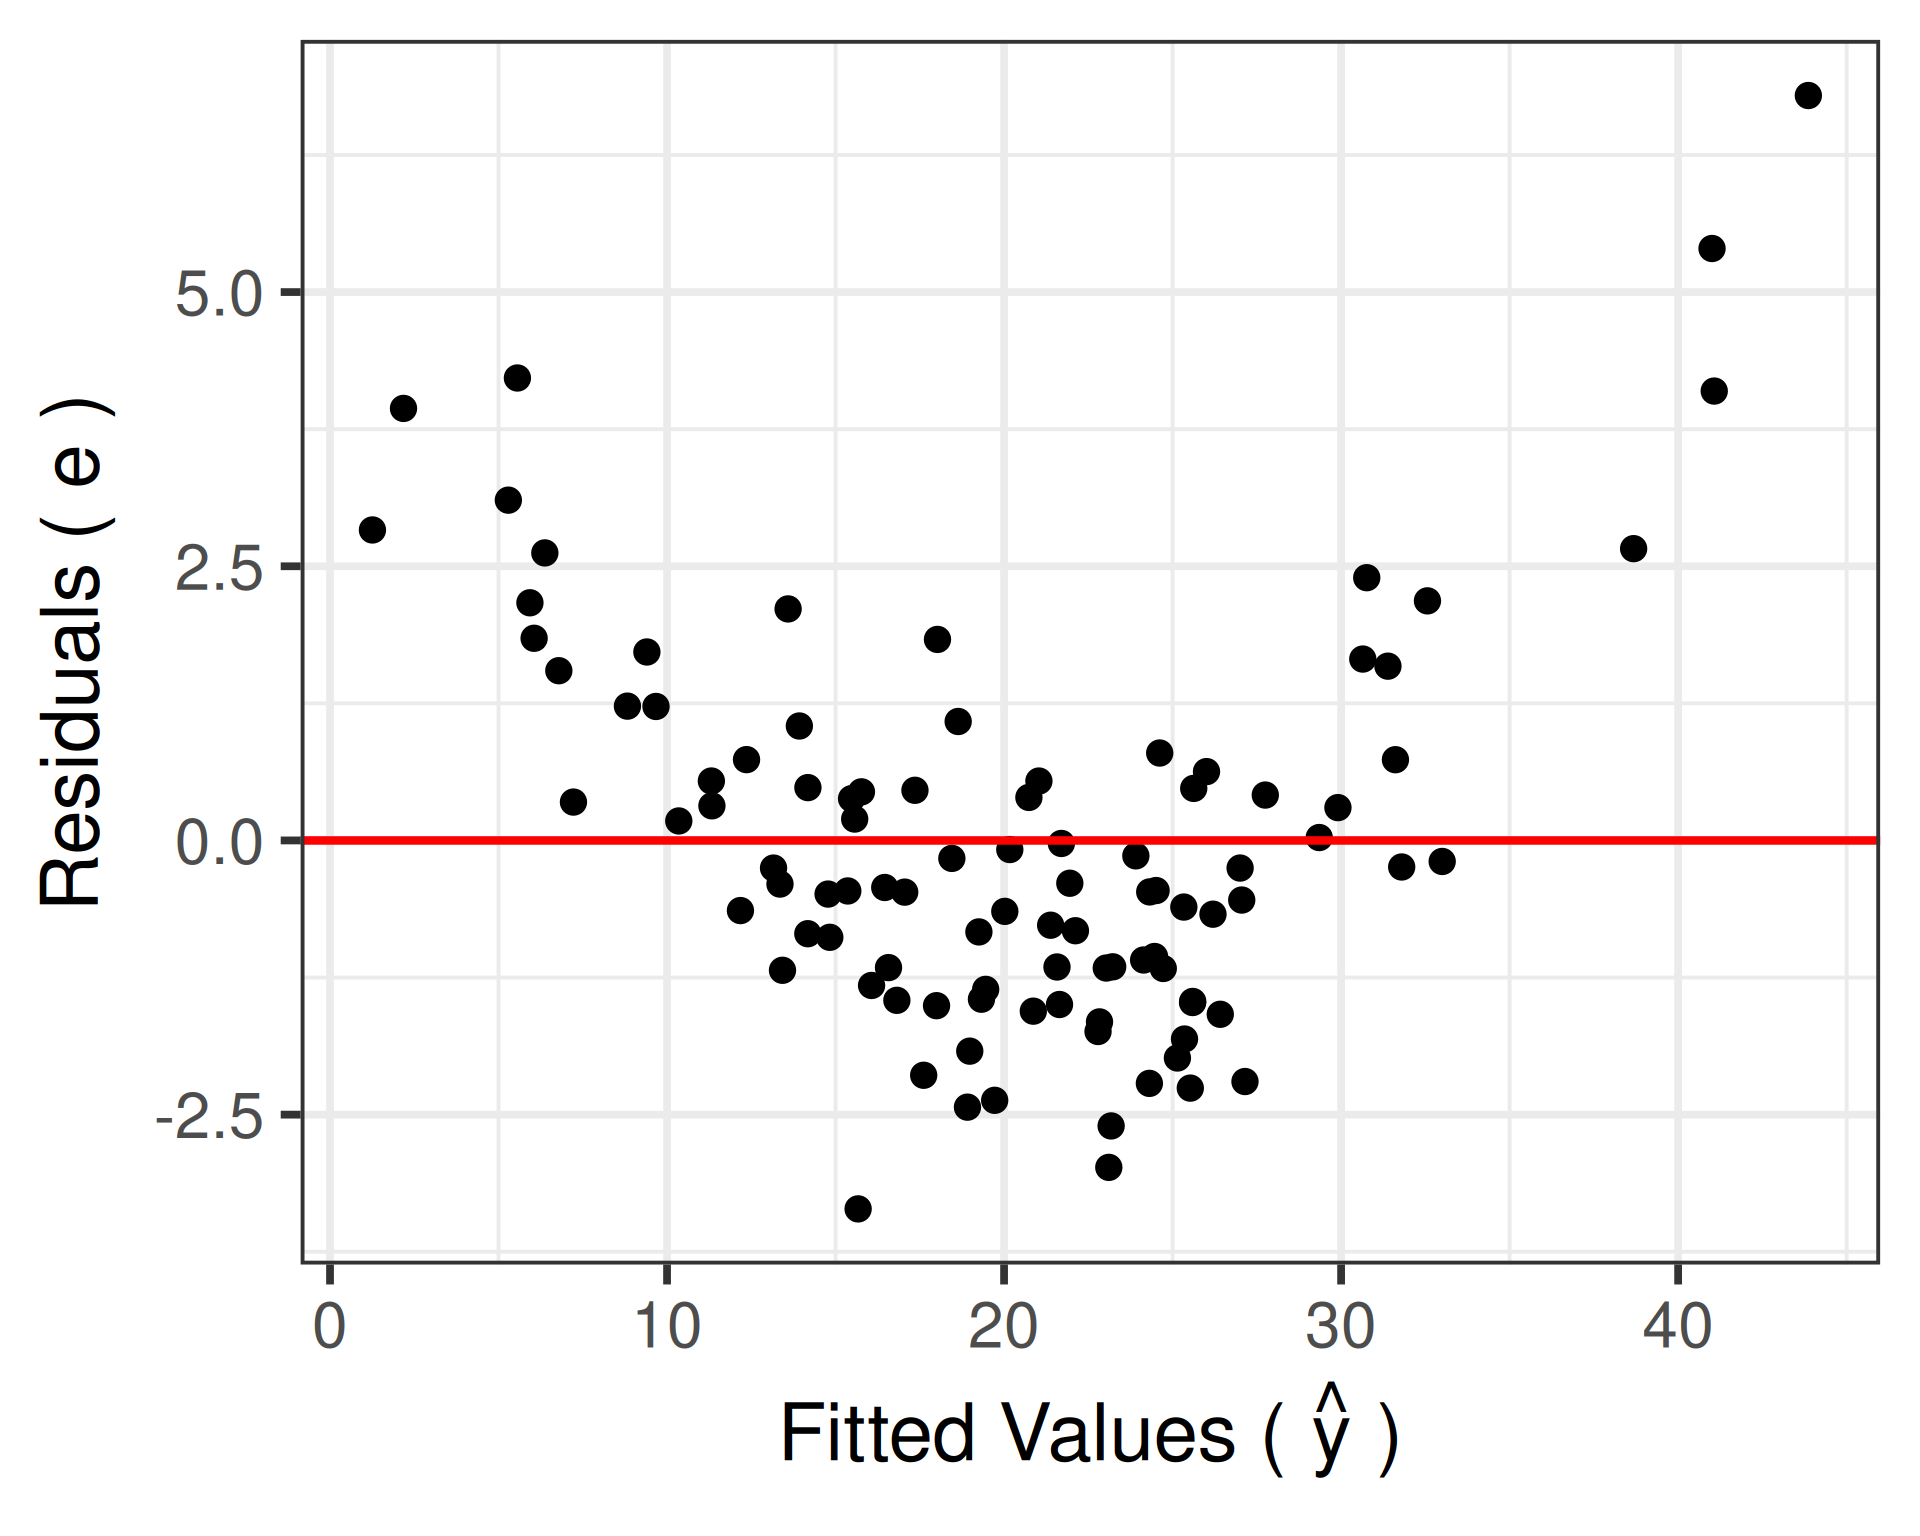
Linearity: 🙎♀️
Patterns (of the residuals being consistently above or below the \(y = 0\) line)
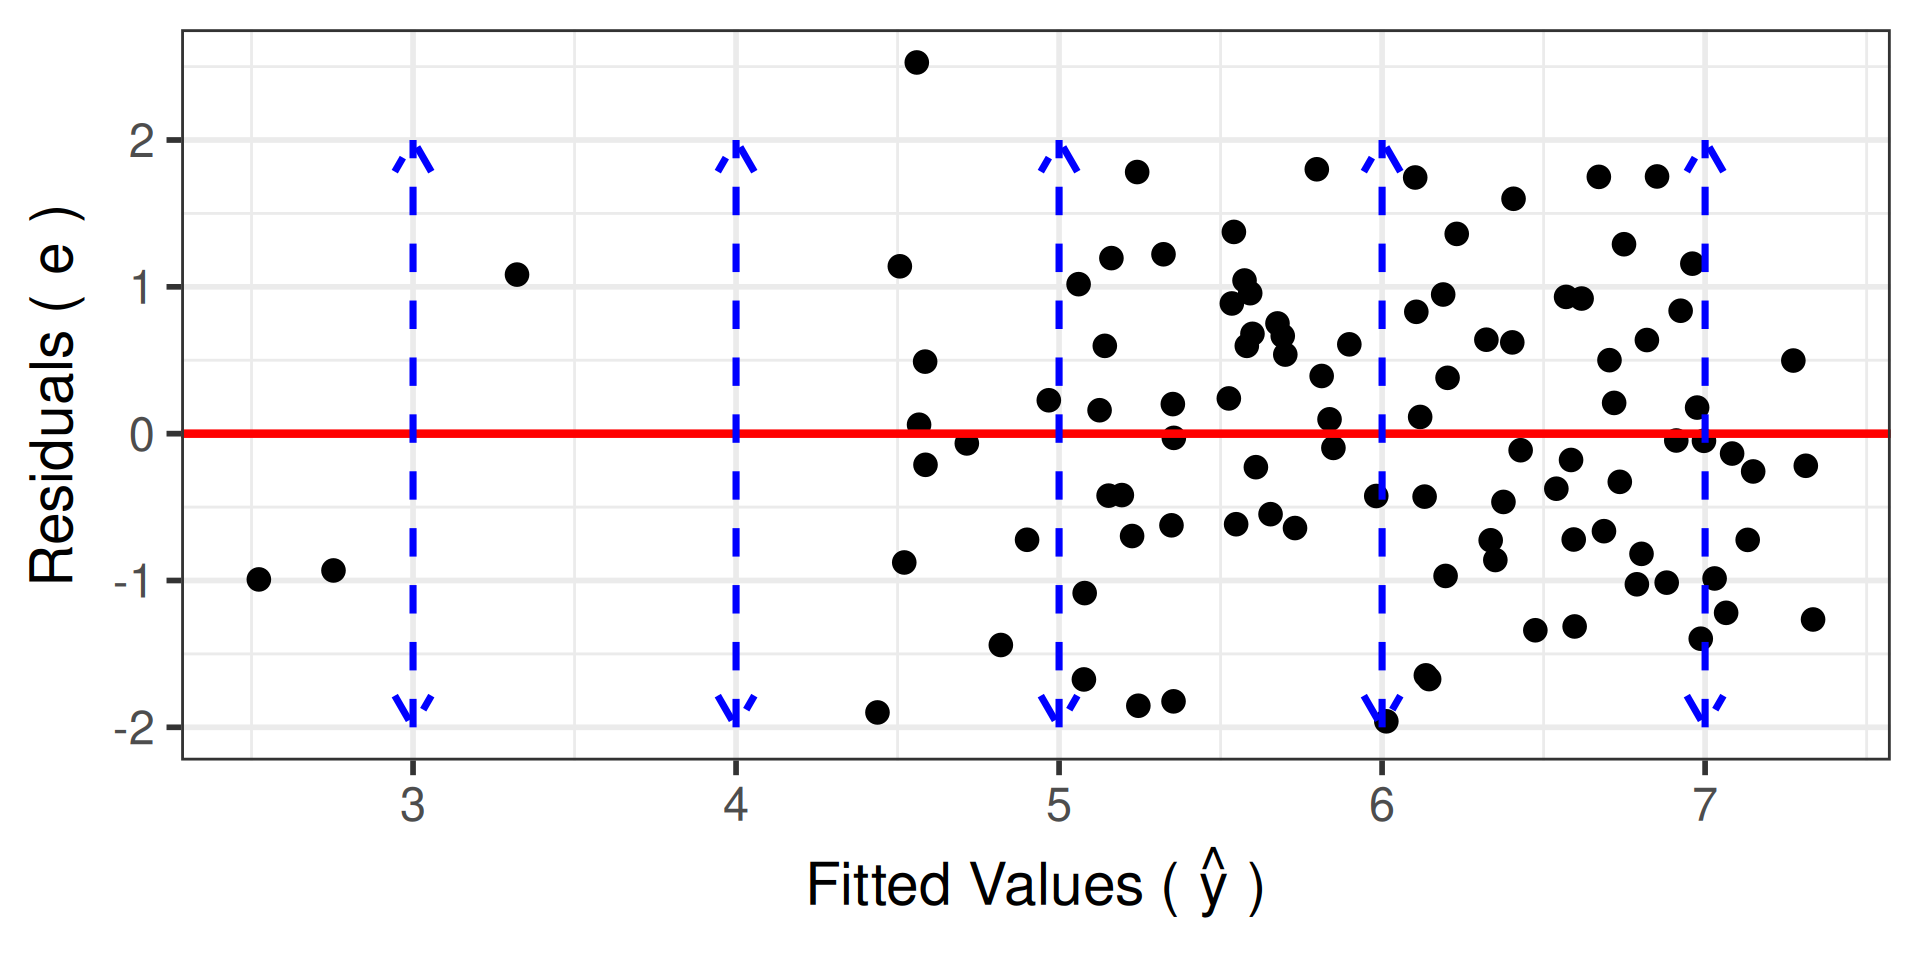
Equal variance 😄
Discrepancies in the horizontal spread of the residuals are fine, but the vertical spread of the residuals should be consistent throughout
![]()
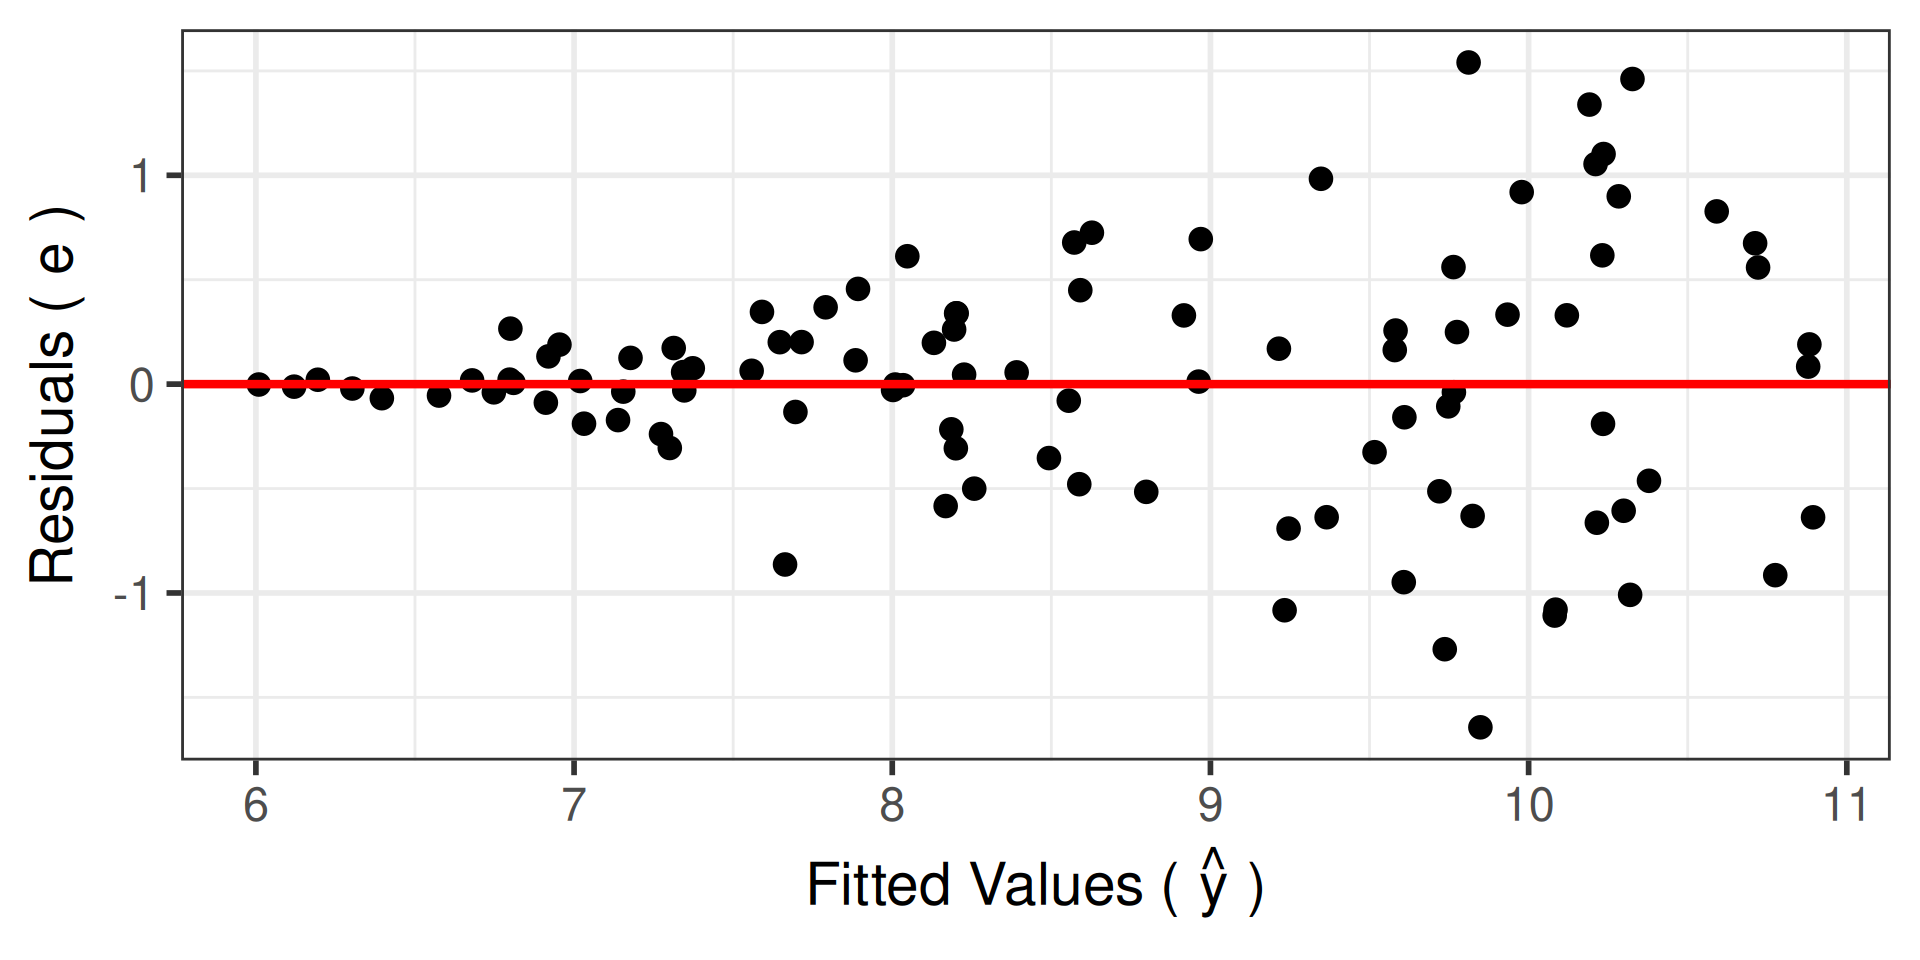
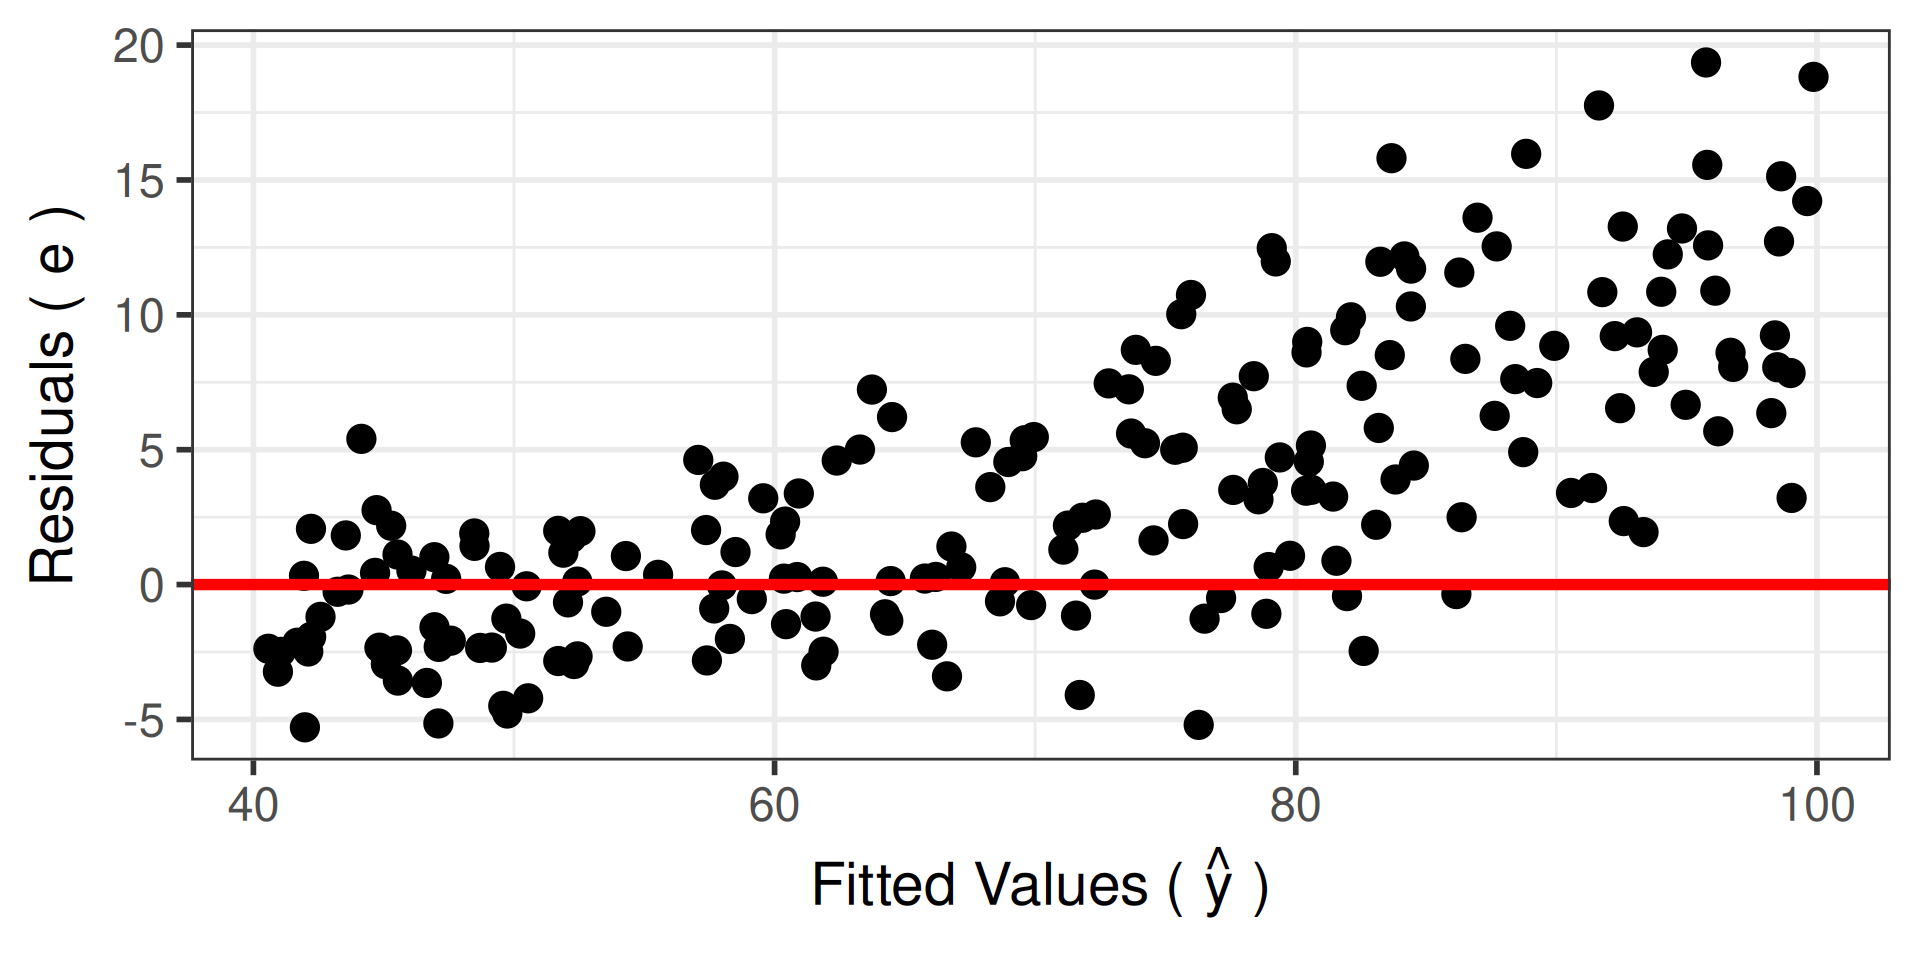
Equal variance: 🙍♂️
Funnel shapes
![]()
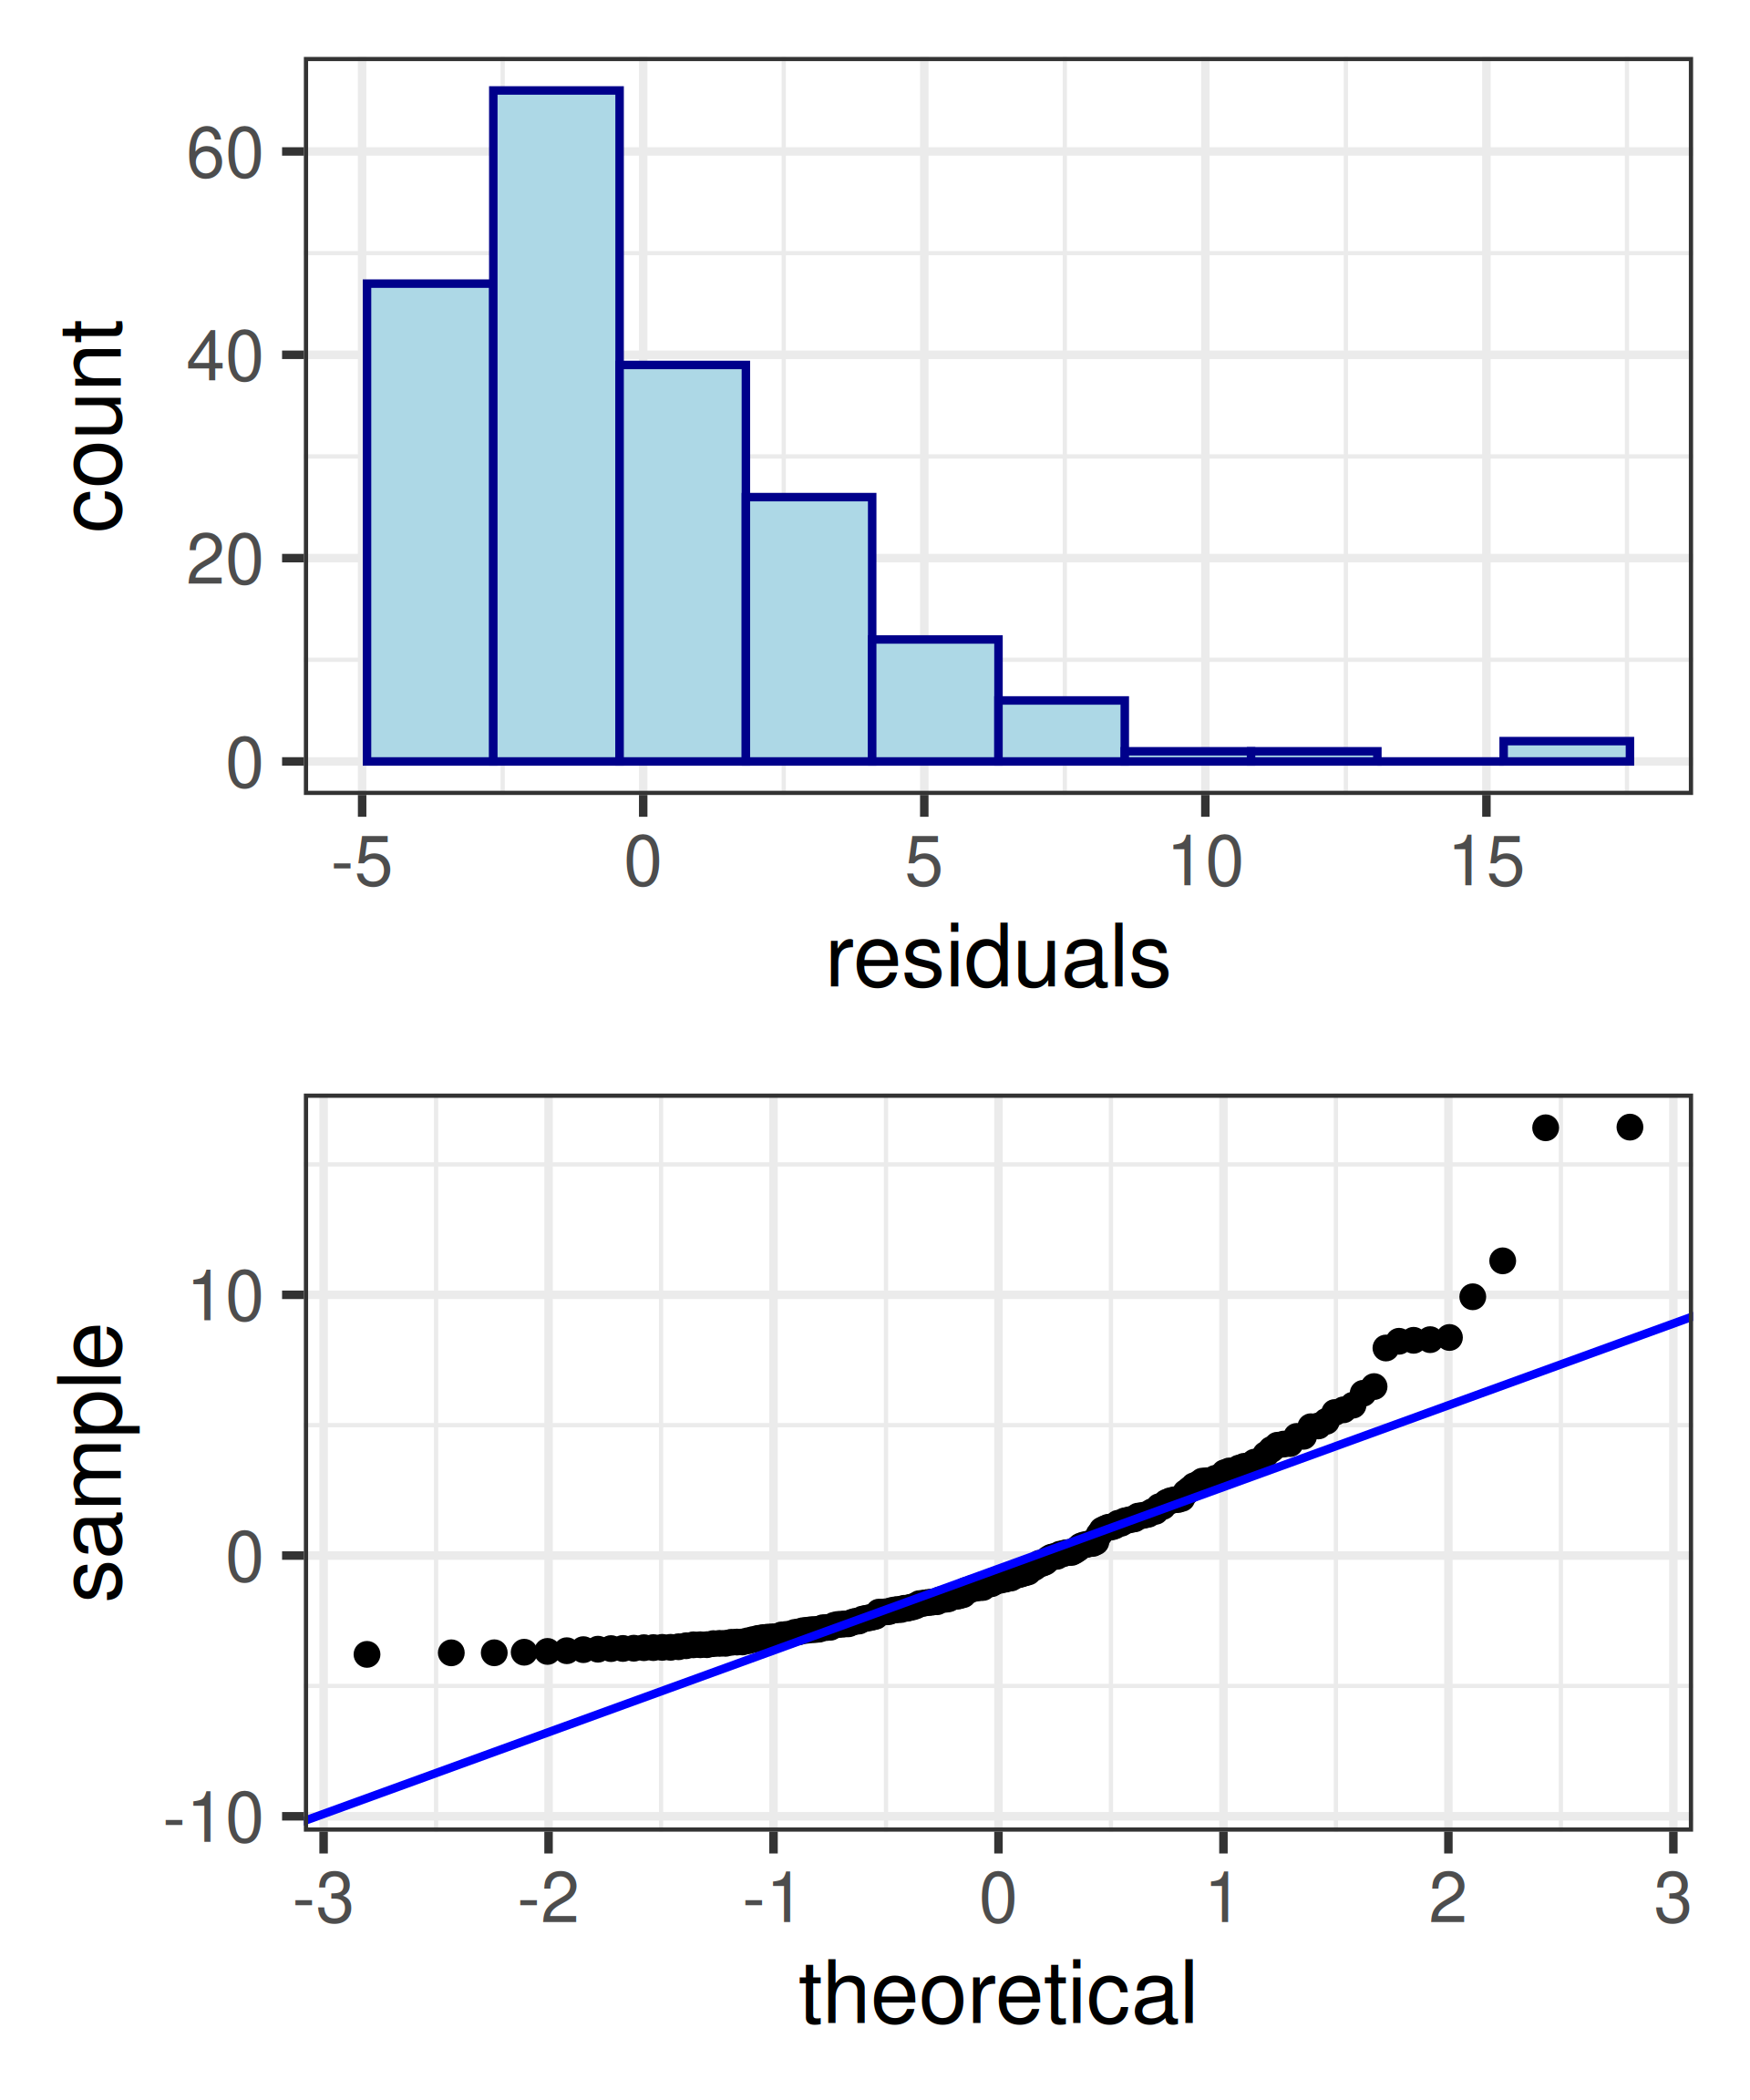
Example 1
![]()
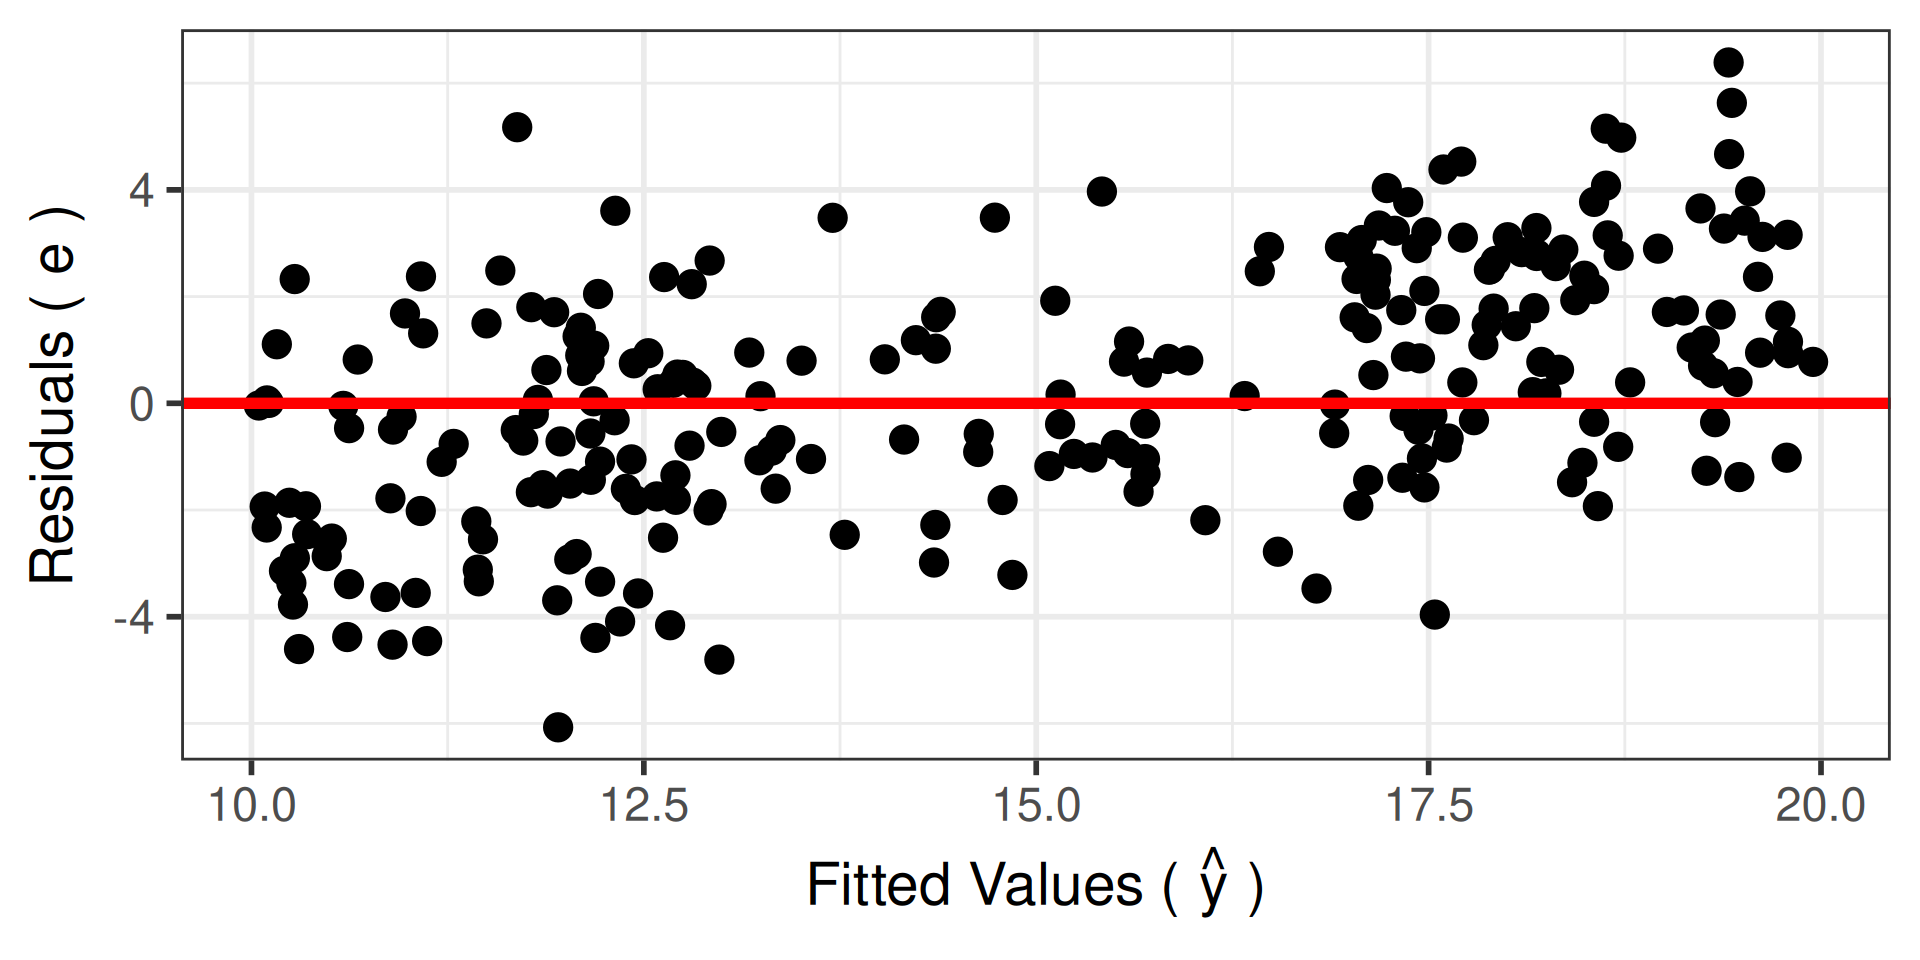
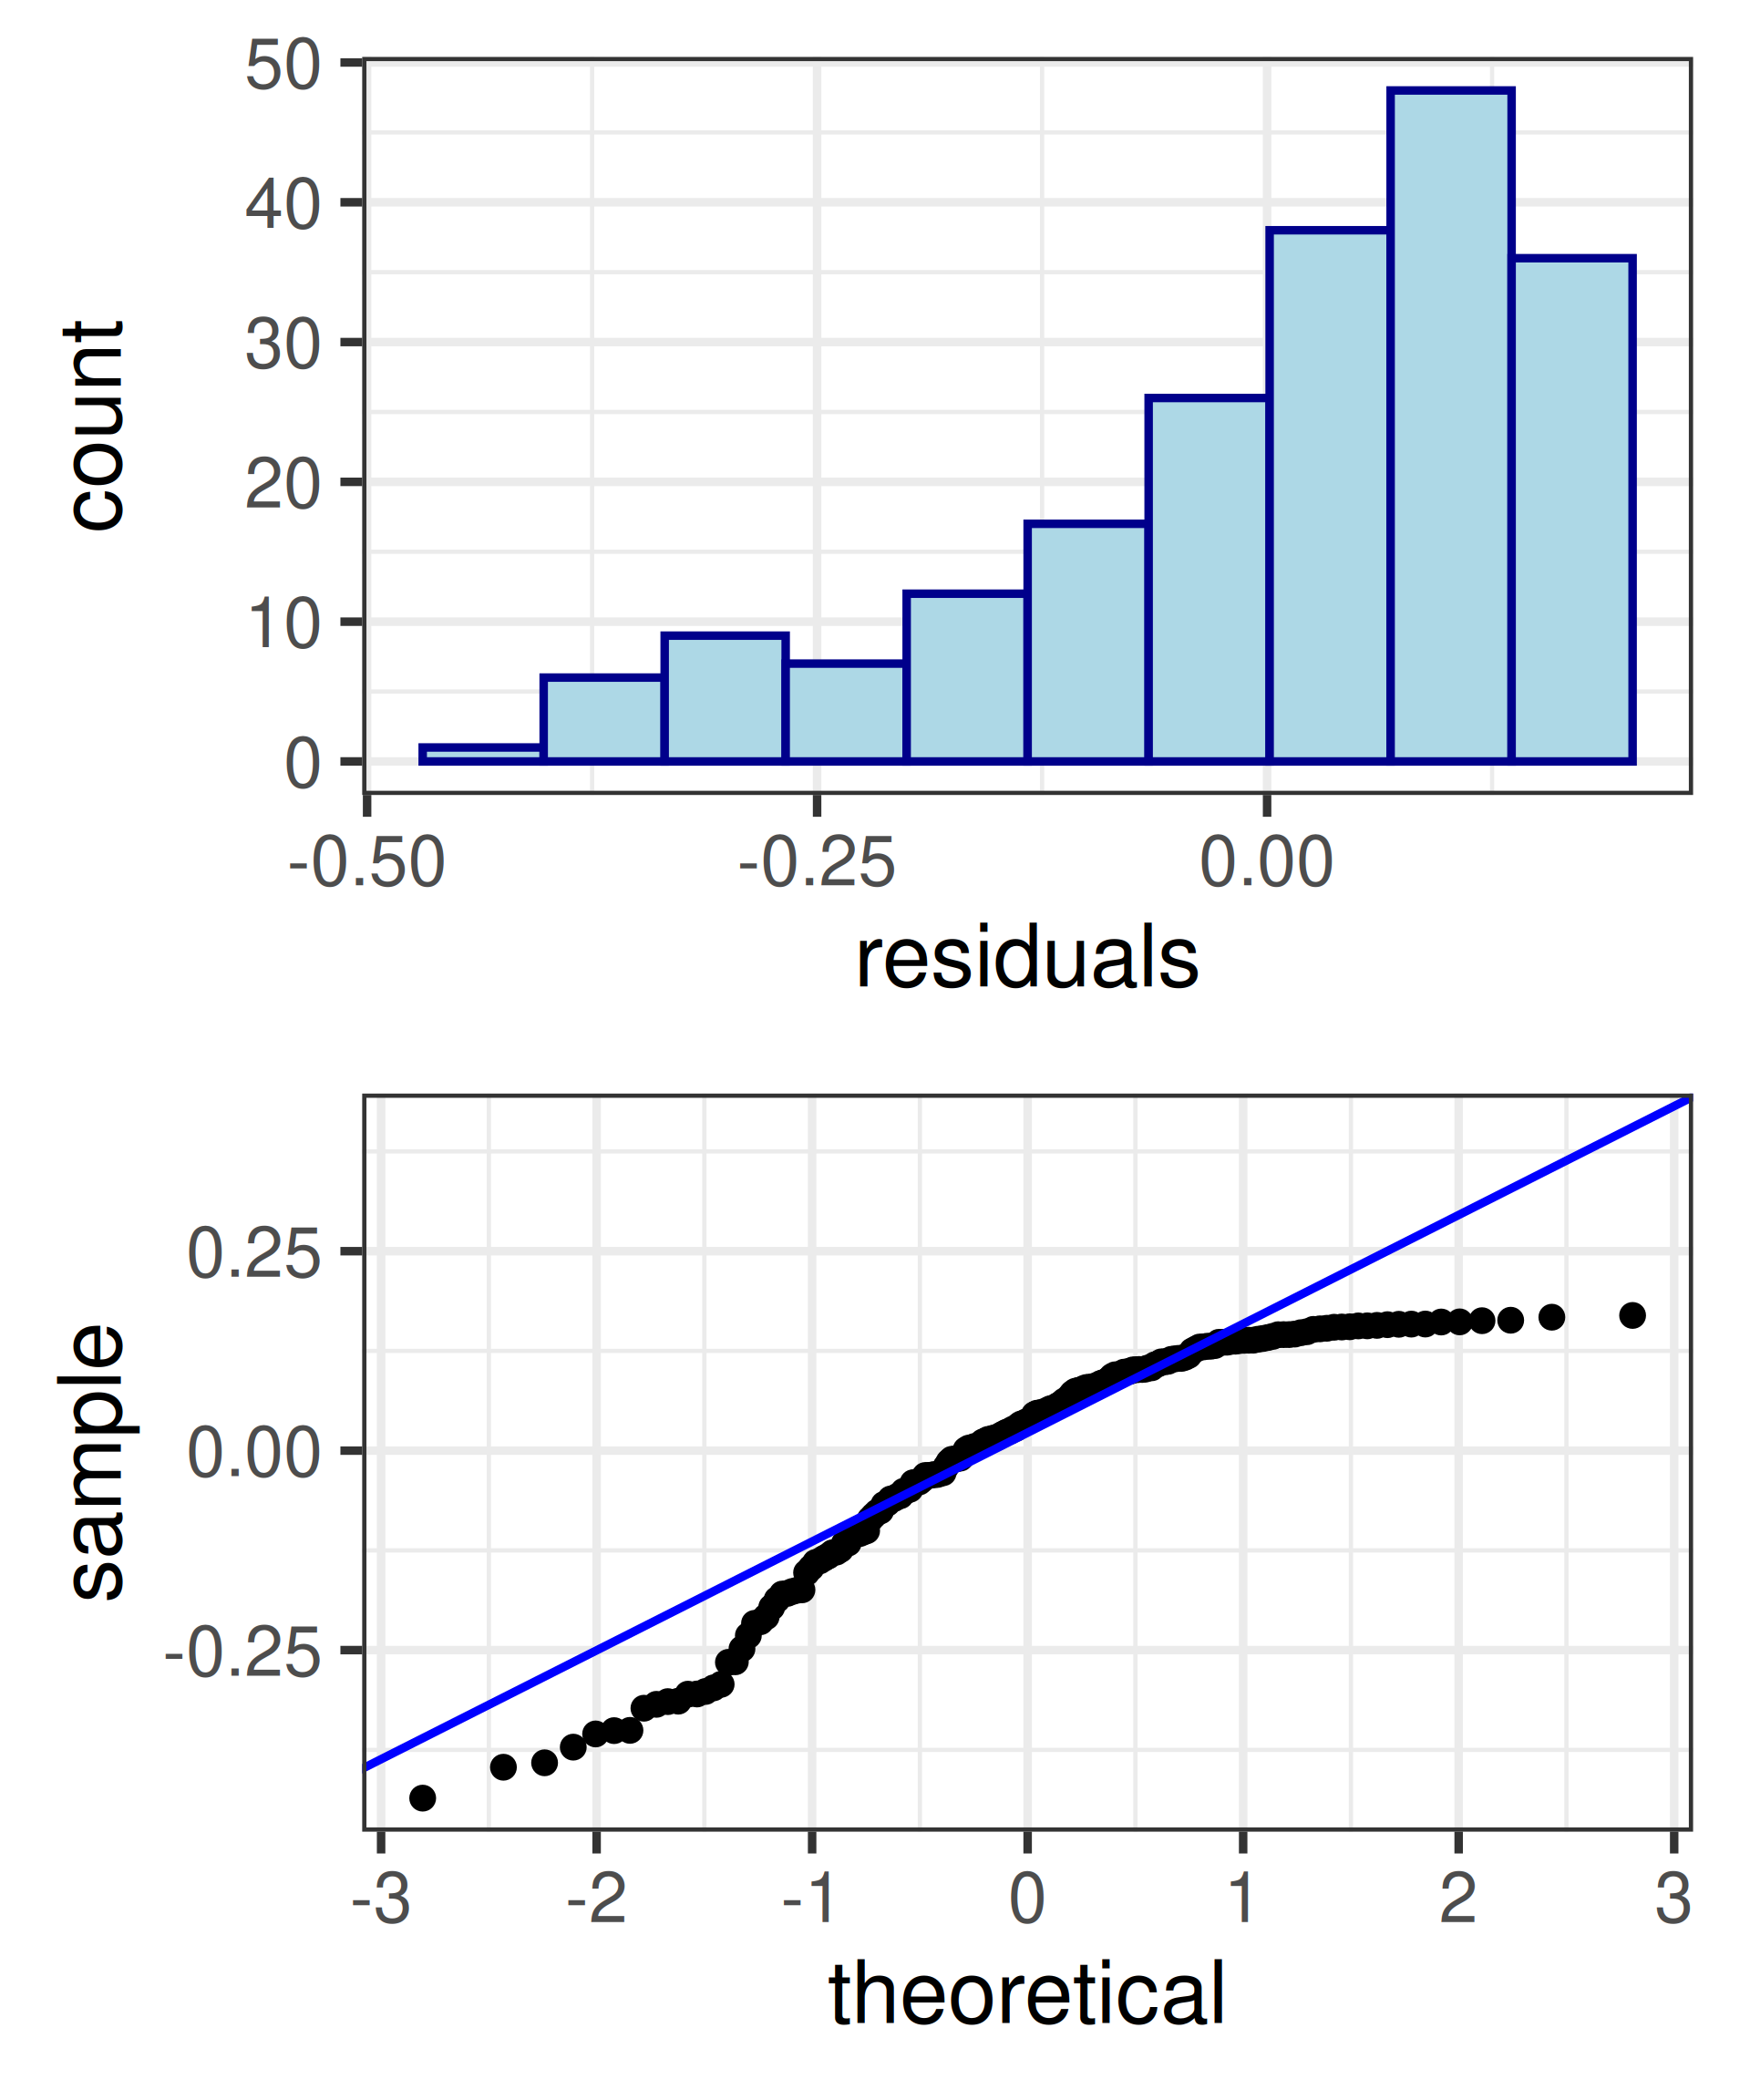
Example 2
![]()
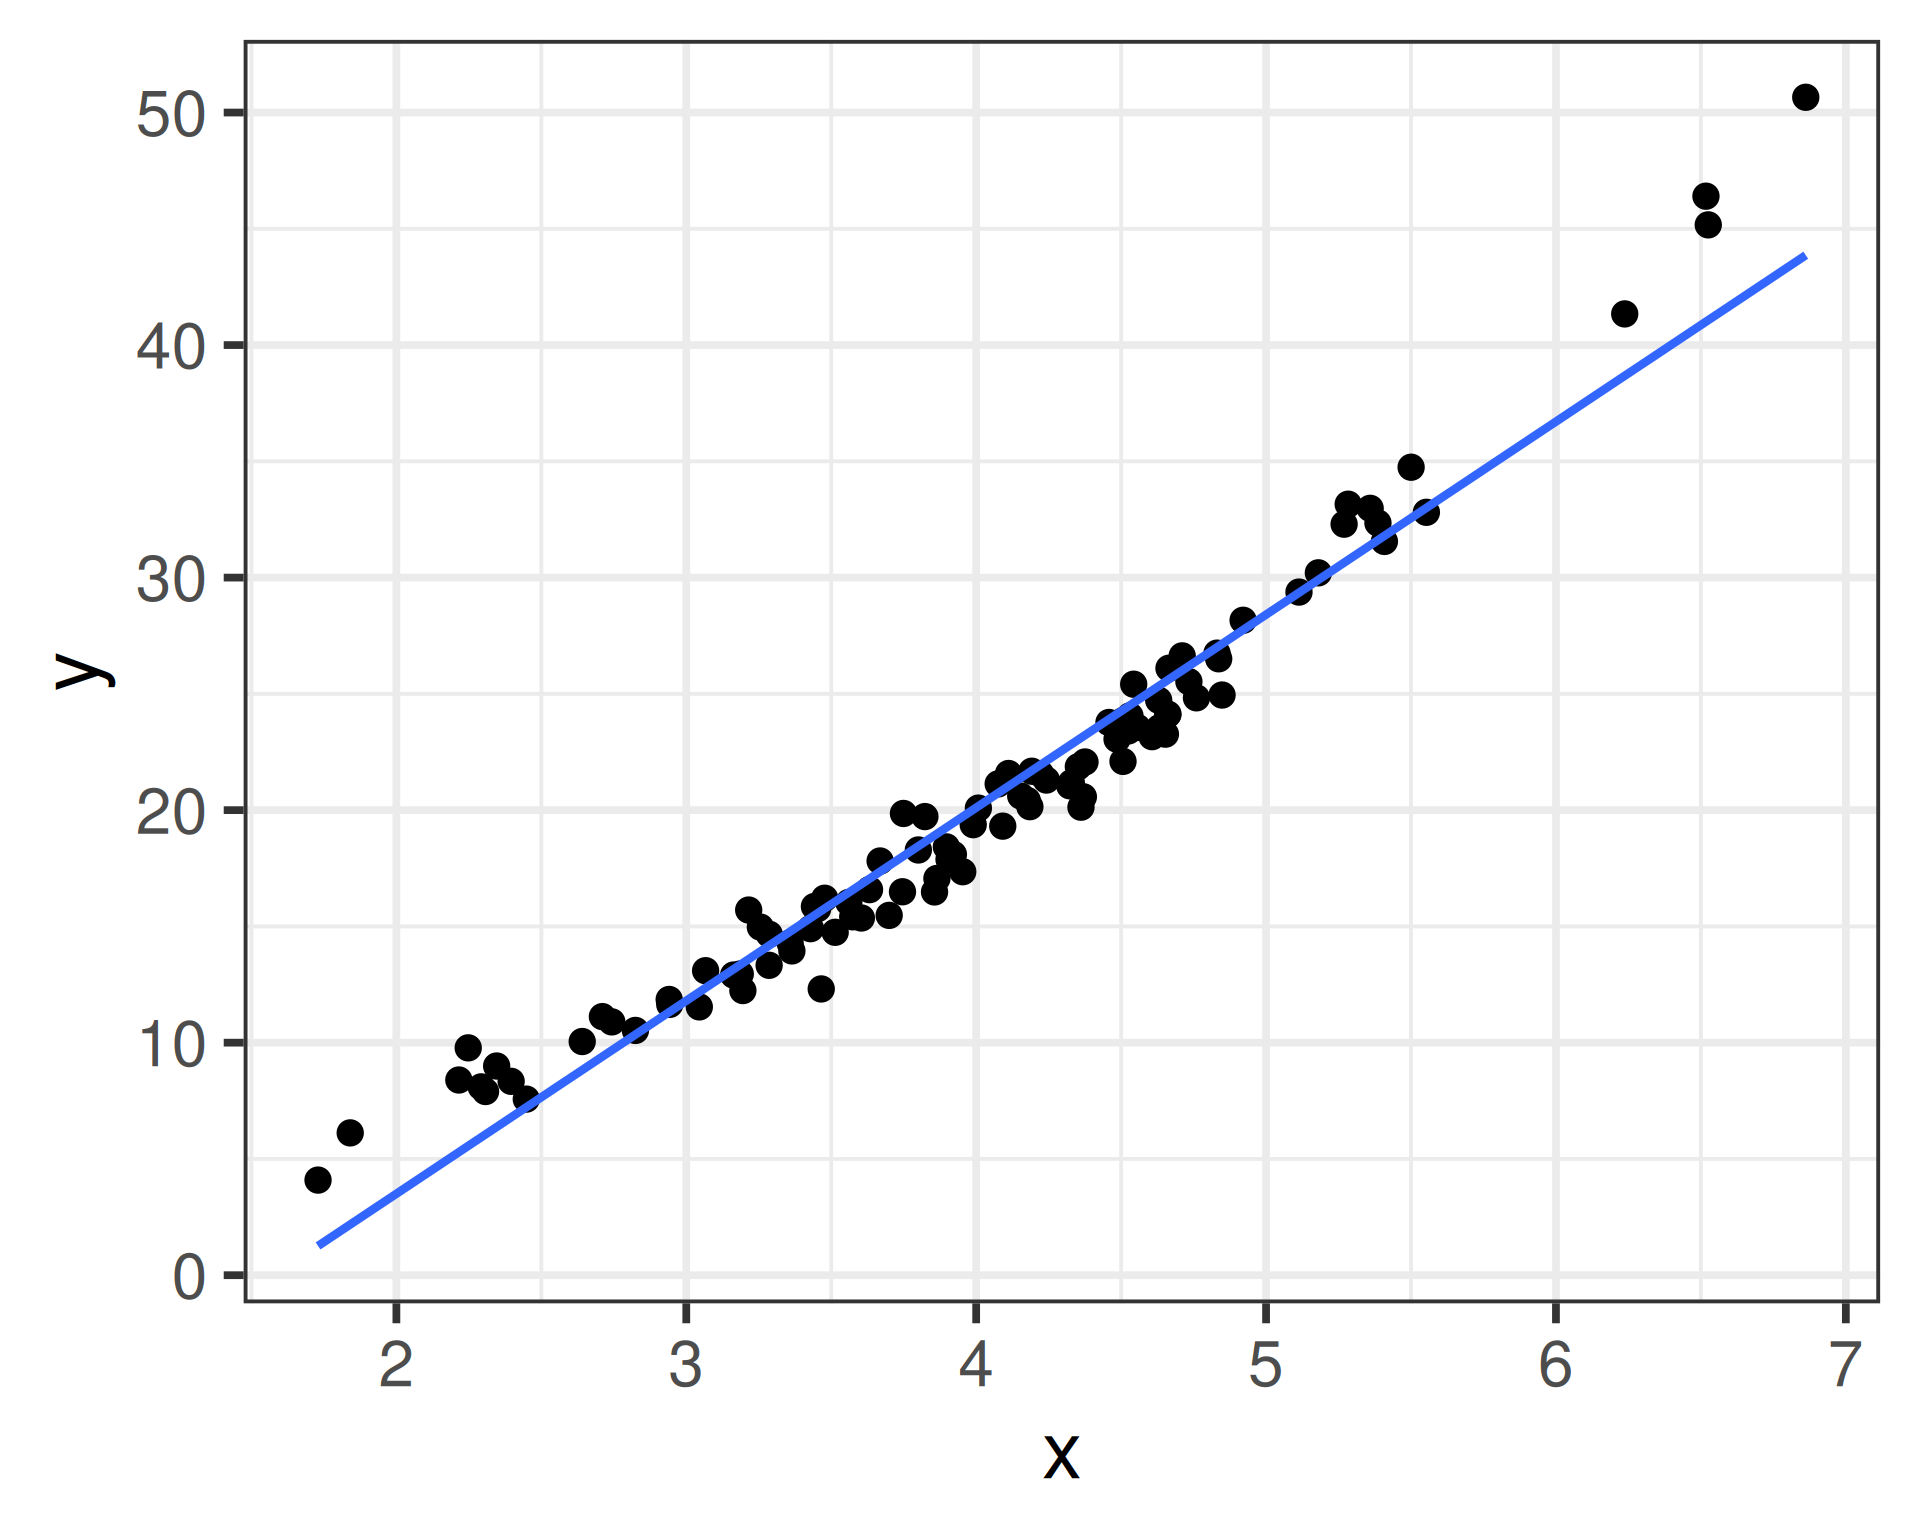
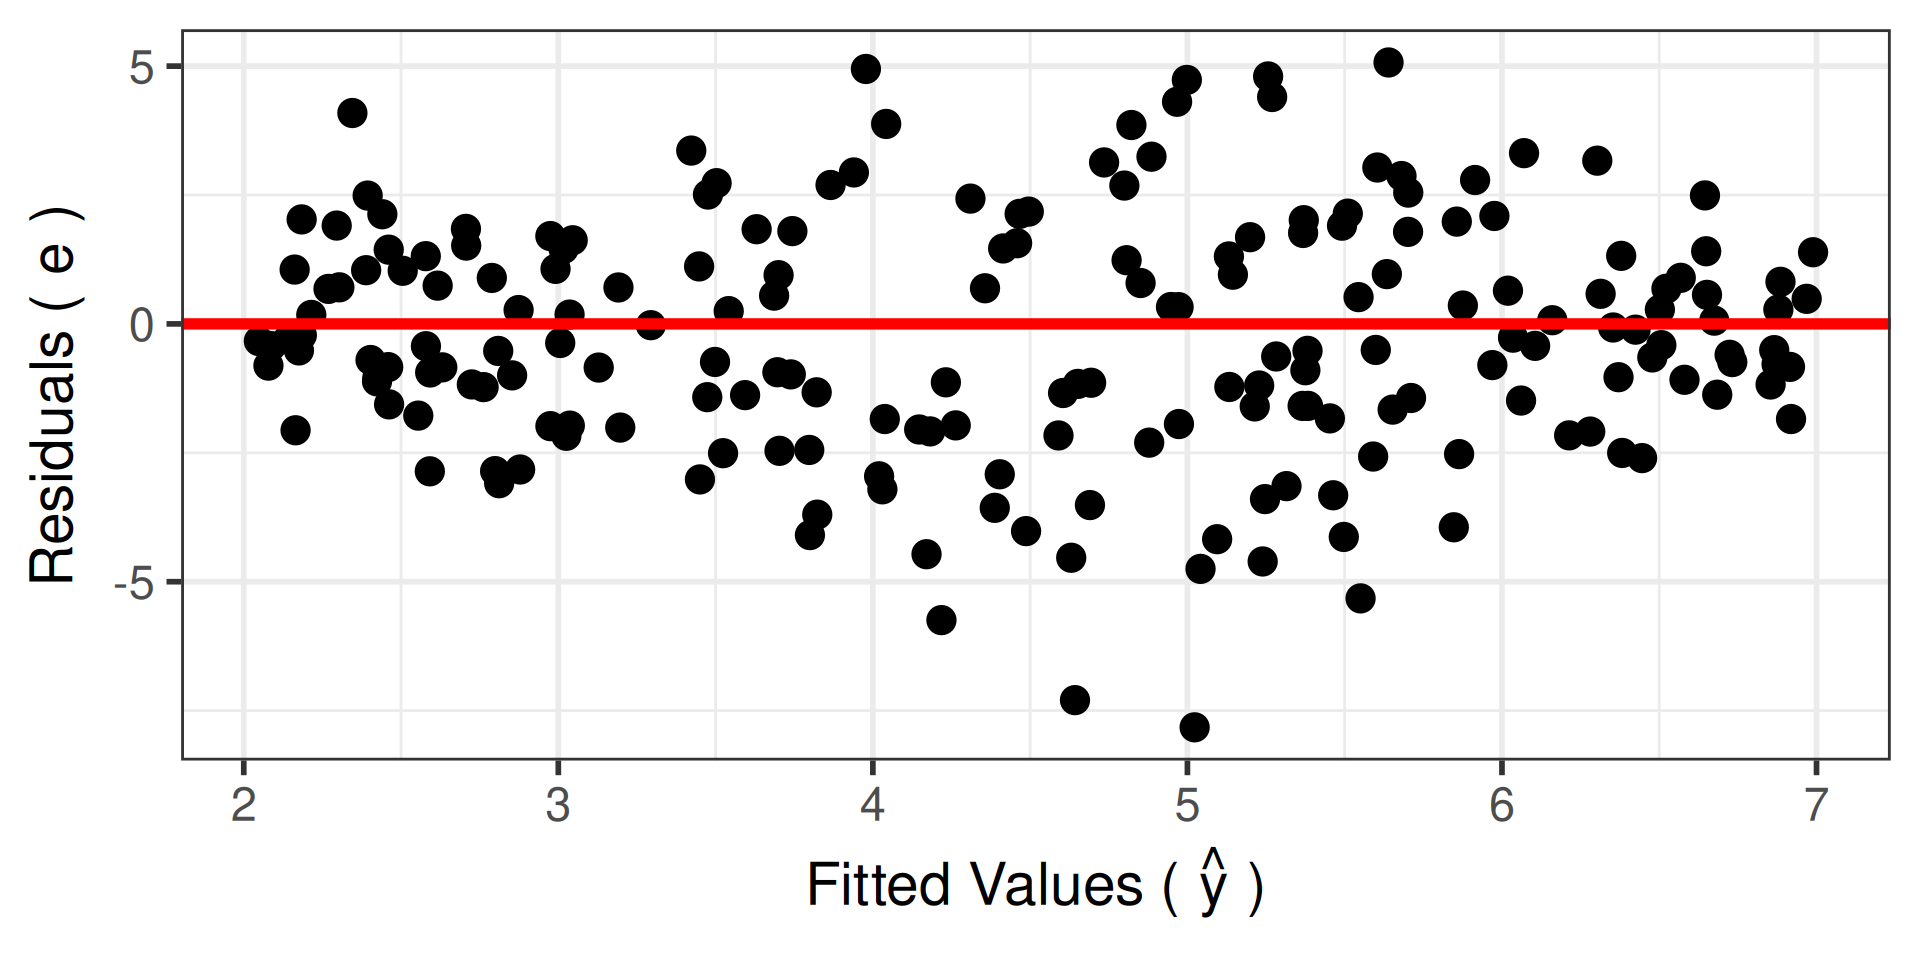
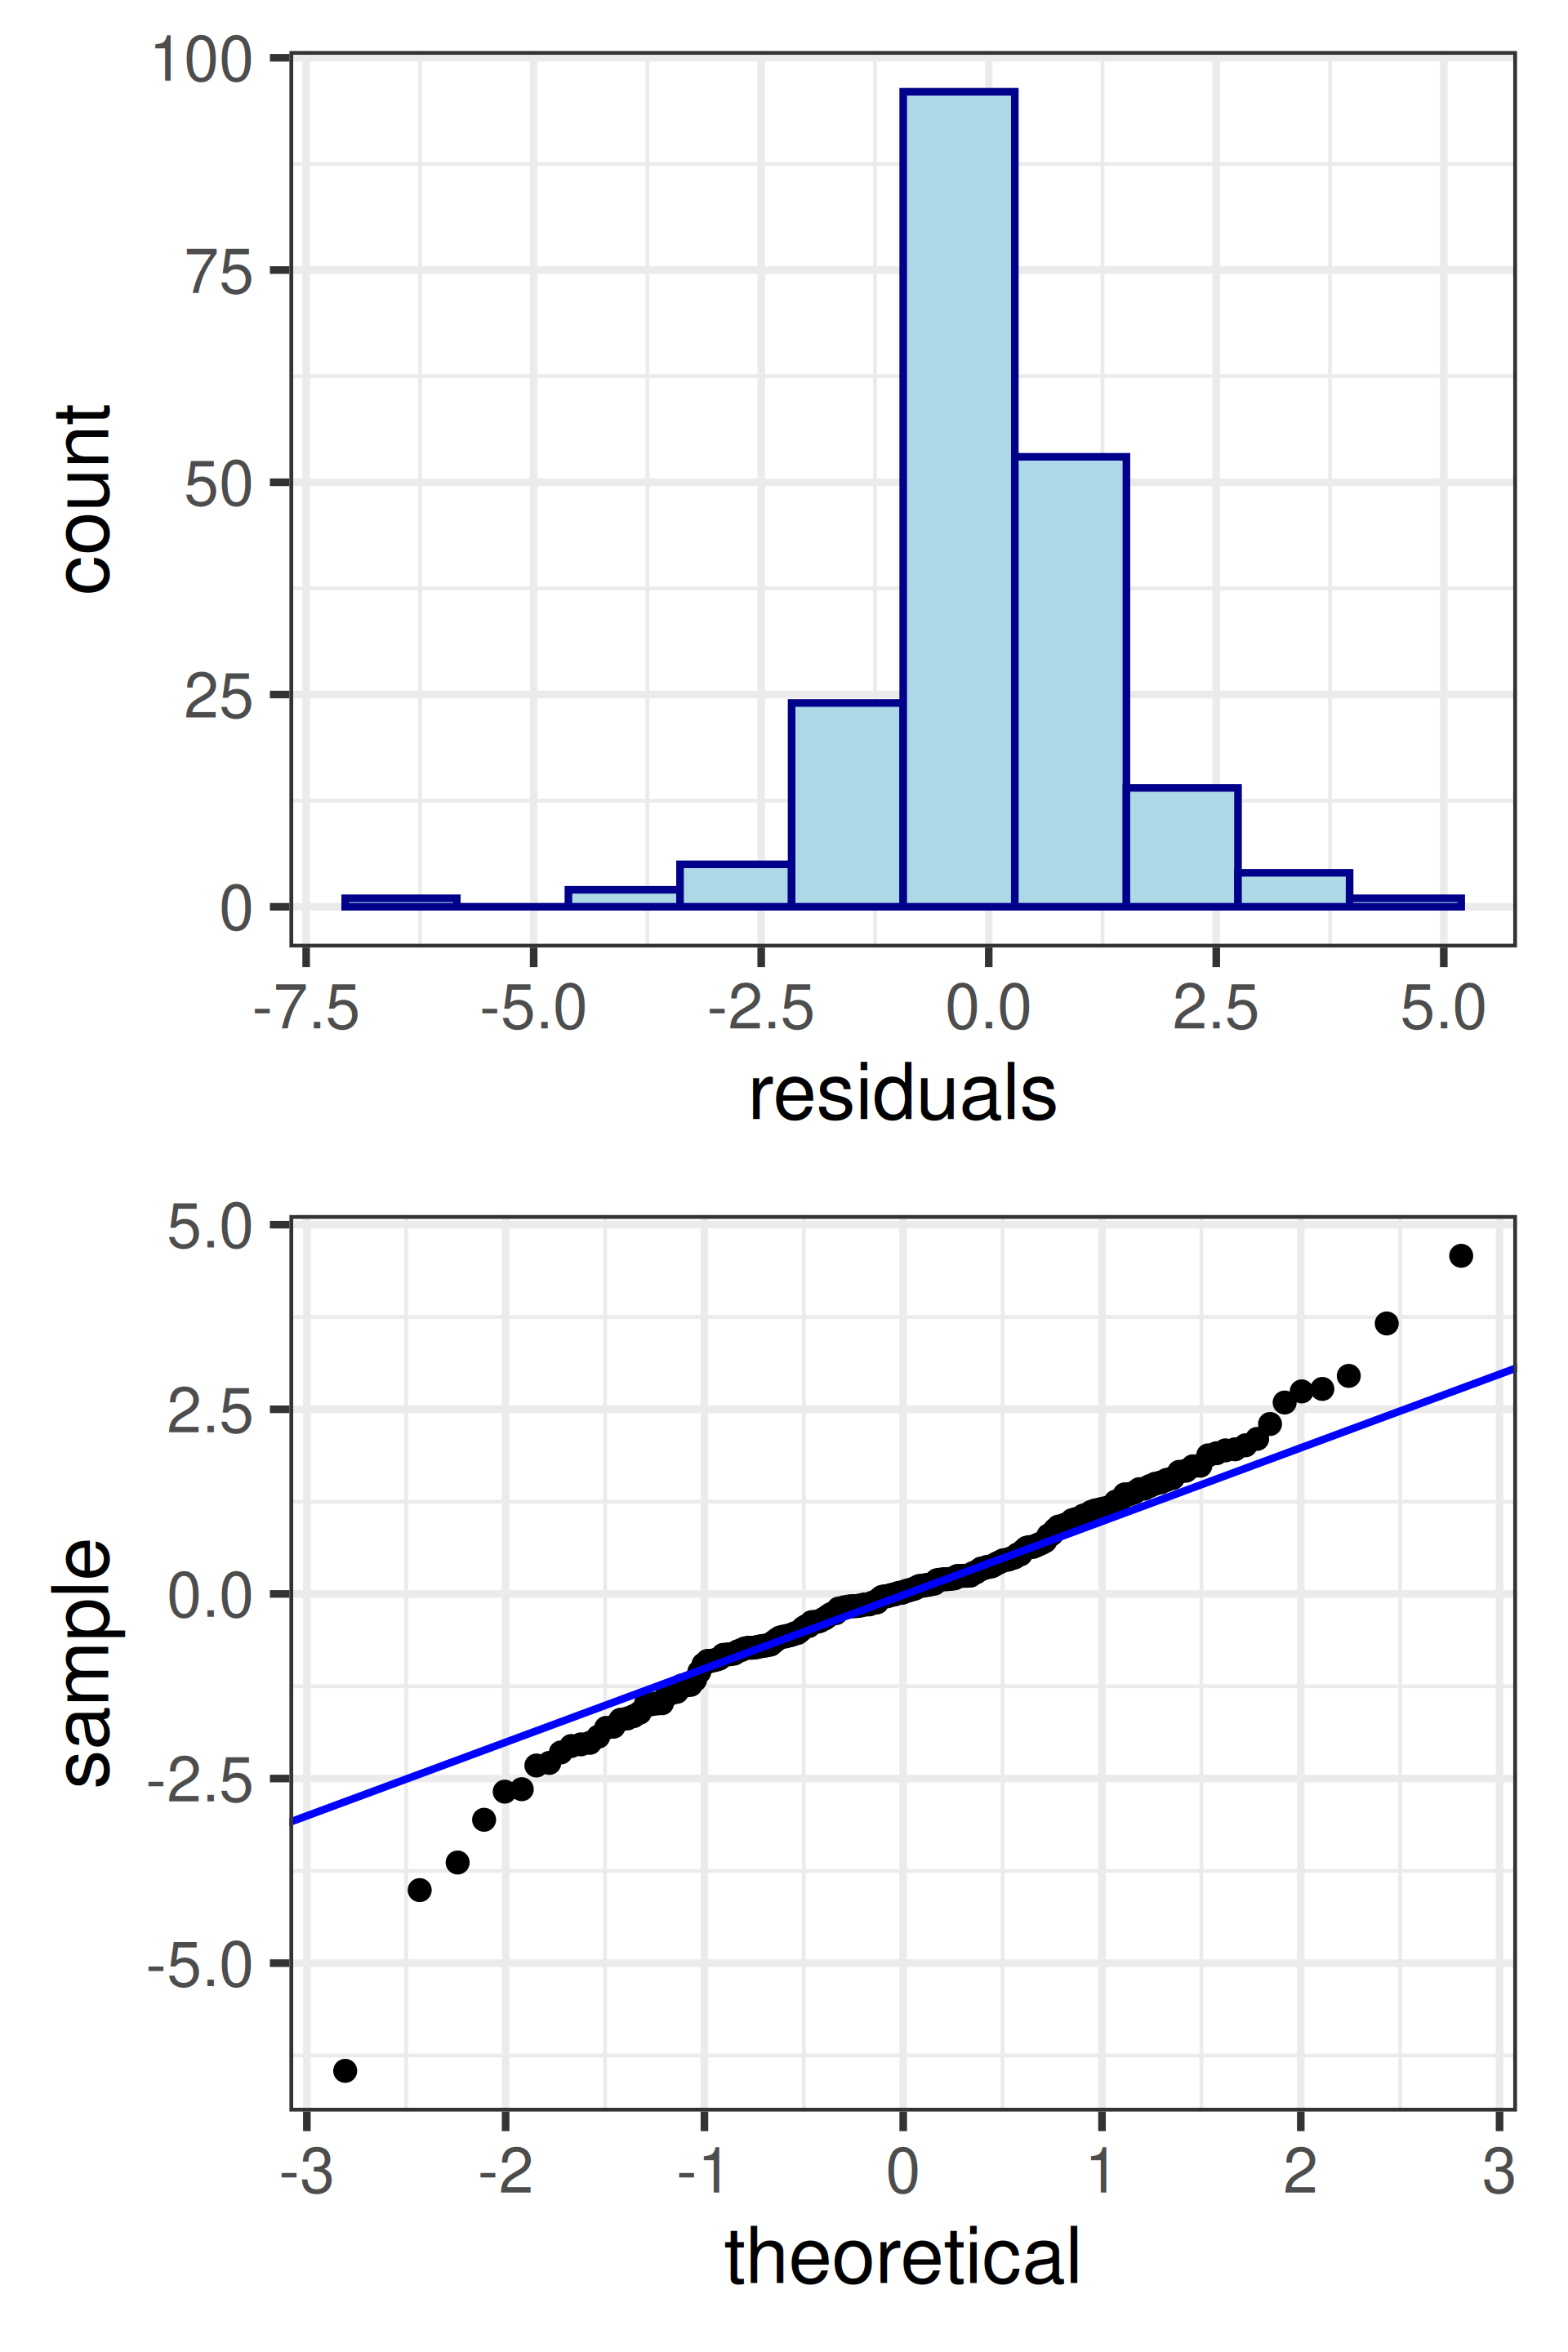
Example 3
![]()
Checking Normality
- By visualizing the distribution of \(e_i\) using a histogram
- Want to see a symmetric, bell-shaped pattern
- Can be hard to tell visually when something is meaningfully different from a bell curve
- By comparing the shape and spread of the residual distribution to that of a Normal distribution using a Normal-Quantile plot, also called a quantile-quantile (QQ) plot
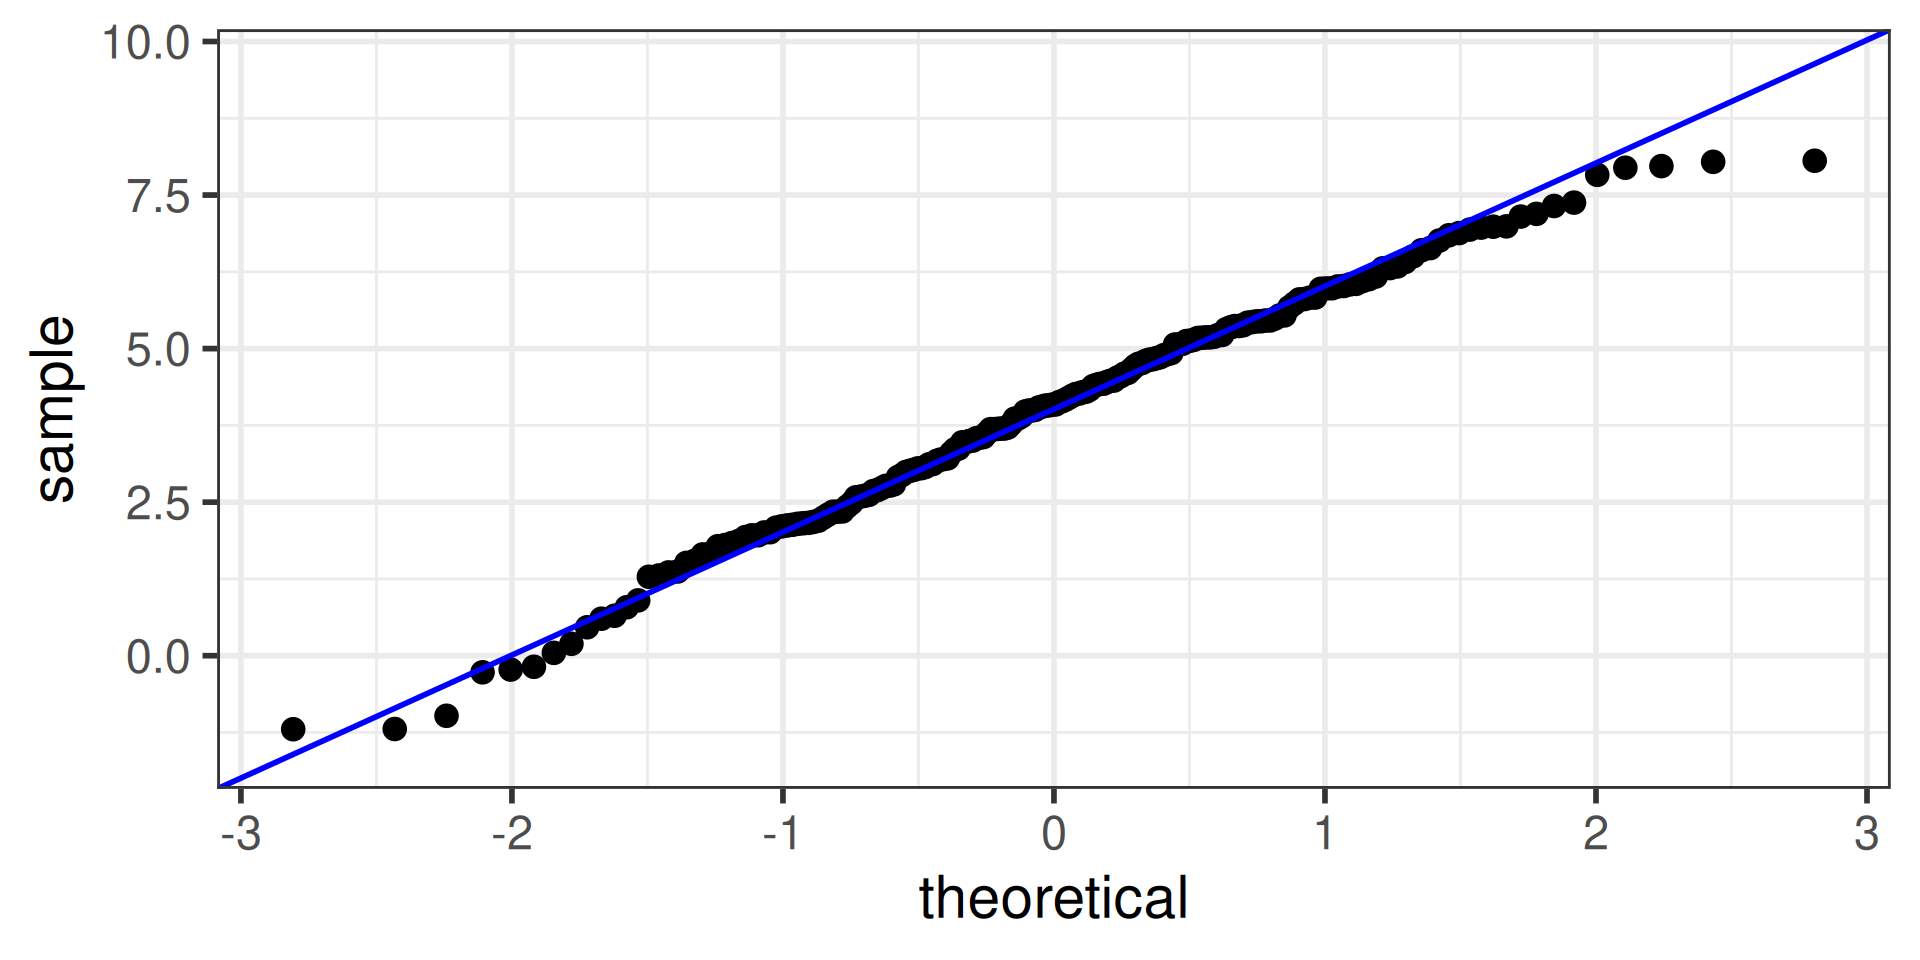
Normality: 😄
The sample quantiles (on the \(y\)-axis) and the theoretical quantiles from a Normal distribution (on the \(x\)-axis) should fall along the reference line
![]()