Call:
lm(formula = bill_depth_mm ~ bill_length_mm + species, data = penguins)

Residuals:
    Min      1Q  Median      3Q     Max
-2.4529 -0.6864 -0.0508  0.5519  3.5915

Coefficients:
               Estimate Std. Error t value Pr(>|t|)
(Intercept)     8.65899    0.86207  10.044  < 2e-16 ***
bill_length_mm  0.19989    0.01749  11.427  < 2e-16 ***
speciesAdelie   1.93319    0.22416   8.624 2.55e-16 ***
speciesGentoo  -3.17283    0.14593 -21.742  < 2e-16 ***
---
Signif. codes:  0 '***' 0.001 '**' 0.01 '*' 0.05 '.' 0.1 ' ' 1

Residual standard error: 0.9533 on 338 degrees of freedom
  (2 observations deleted due to missingness)
Multiple R-squared:  0.769, Adjusted R-squared:  0.7669
F-statistic: 375.1 on 3 and 338 DF, p-value: < 2.2e-1613-MLR with Interaction
SDS 291
Prof. Baumer
October 20, 2025
Recall: penguins
Visualizing the model
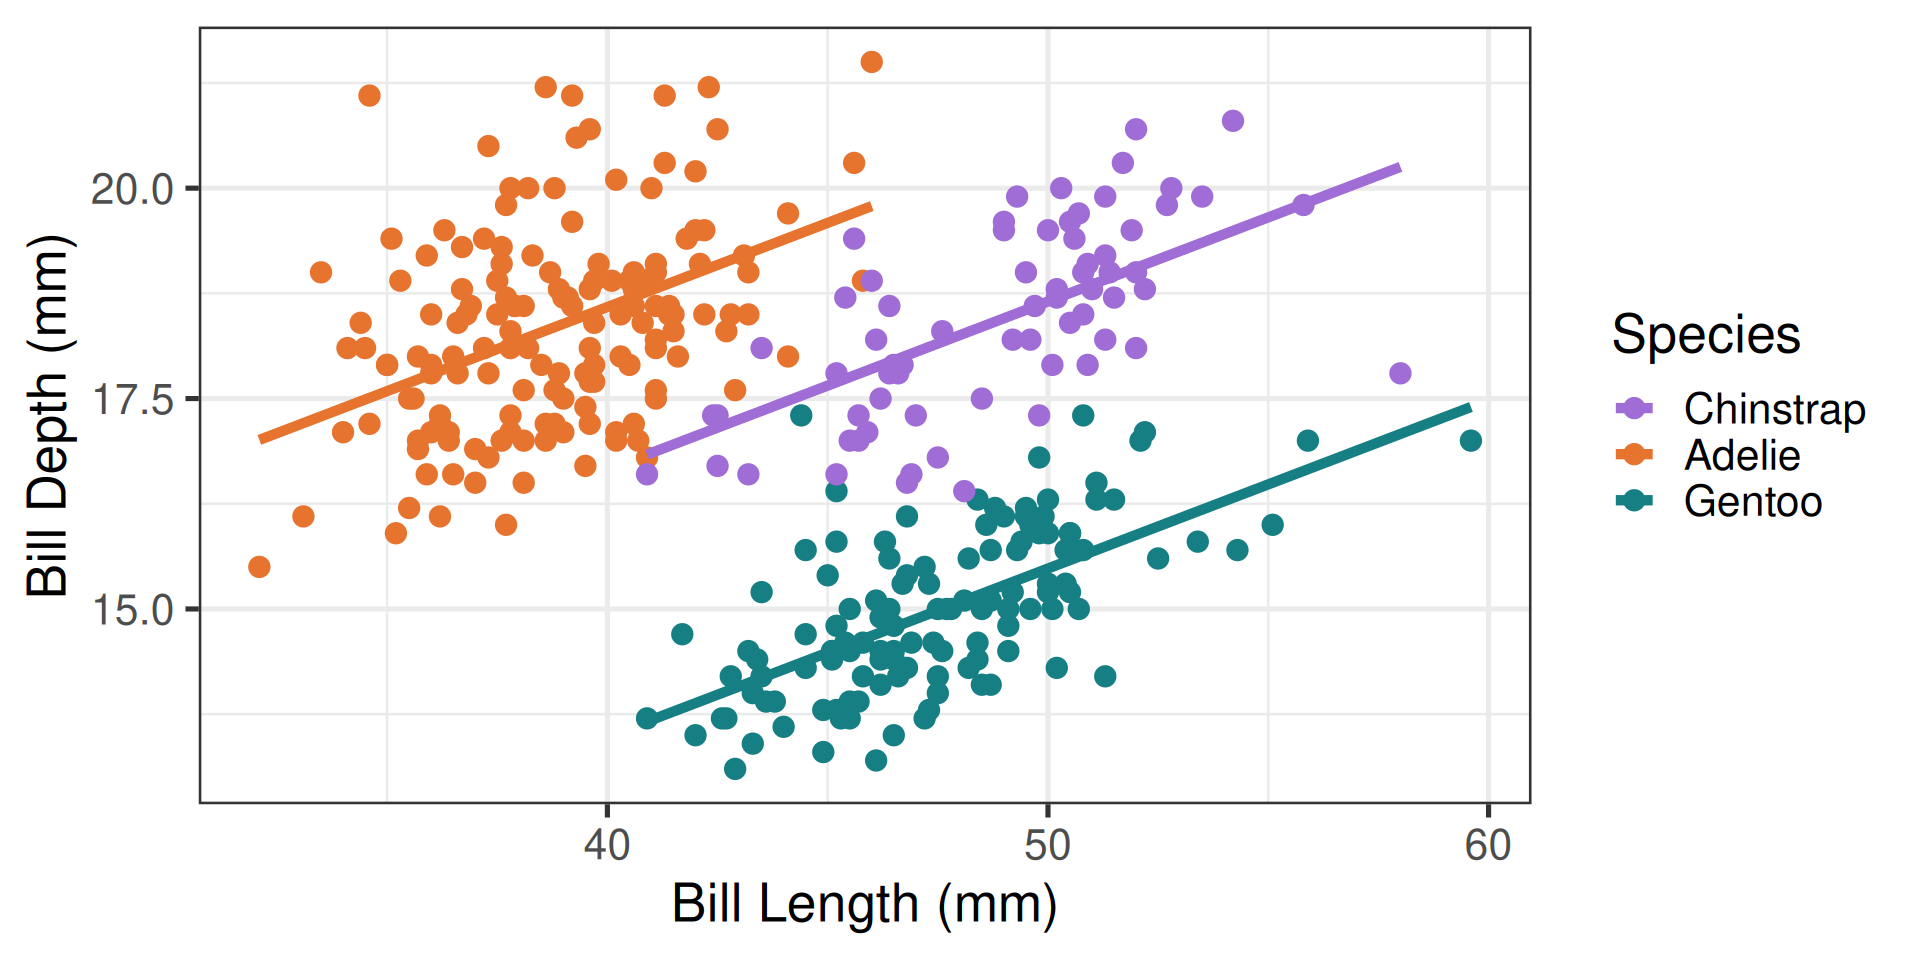
Parallel slopes model
General Parallel Slopes Model for the Mean
Let \(Y\) be penguin bill depth, \(x_1\) penguin bill length, and \(x_2\) and \(x_3\) species indicators for Adelie and Gentoo penguins, respectively. Then \[E[Y|x_1, x_2, x_3] = \beta_0 + \beta_1 x_1 + \beta_2x_2 + \beta_3x_3\]
- slope (\(\beta_1\)) is exactly the same for all levels of the categorical variable
- Indicator variables (\(\beta_2, \beta_3\)) capture the change in the mean response value from the reference level (\(\beta_0\))
- Adelie (\(\beta_2\)) vs. Chinstrap penguins (\(\beta_0\))
- Gentoo (\(\beta_2\)) vs. Chinstrap penguins (\(\beta_0\))
Interpreting parallel slopes
Our fitted parallel slopes model for penguin bill depth is \[\widehat{y} = 8.66 + 0.20x_1 + 1.93x_2 - 3.17 x_3\]
Intercept: The mean bill depth for a Chinstrap penguin with a bill length of 0 mm is 8.66 mm.- Bill Length, \(x_1\): Holding penguin species constant, we estimate that a one mm increase in bill length is associated with a 0.20 mm increase in the mean bill depth.
- Adelie Indicator, \(x_2\): The mean bill depth for Adelie penguins is estimated to be 1.93 mm greater than that for Chinstrap penguins, holding bill length constant.
- Gentoo Indicator, \(x_3\): The mean bill depth for Gentoo penguins is estimated to be 3.17 mm smaller than that for Chinstrap penguins, holding bill length constant.
Interaction models
Note
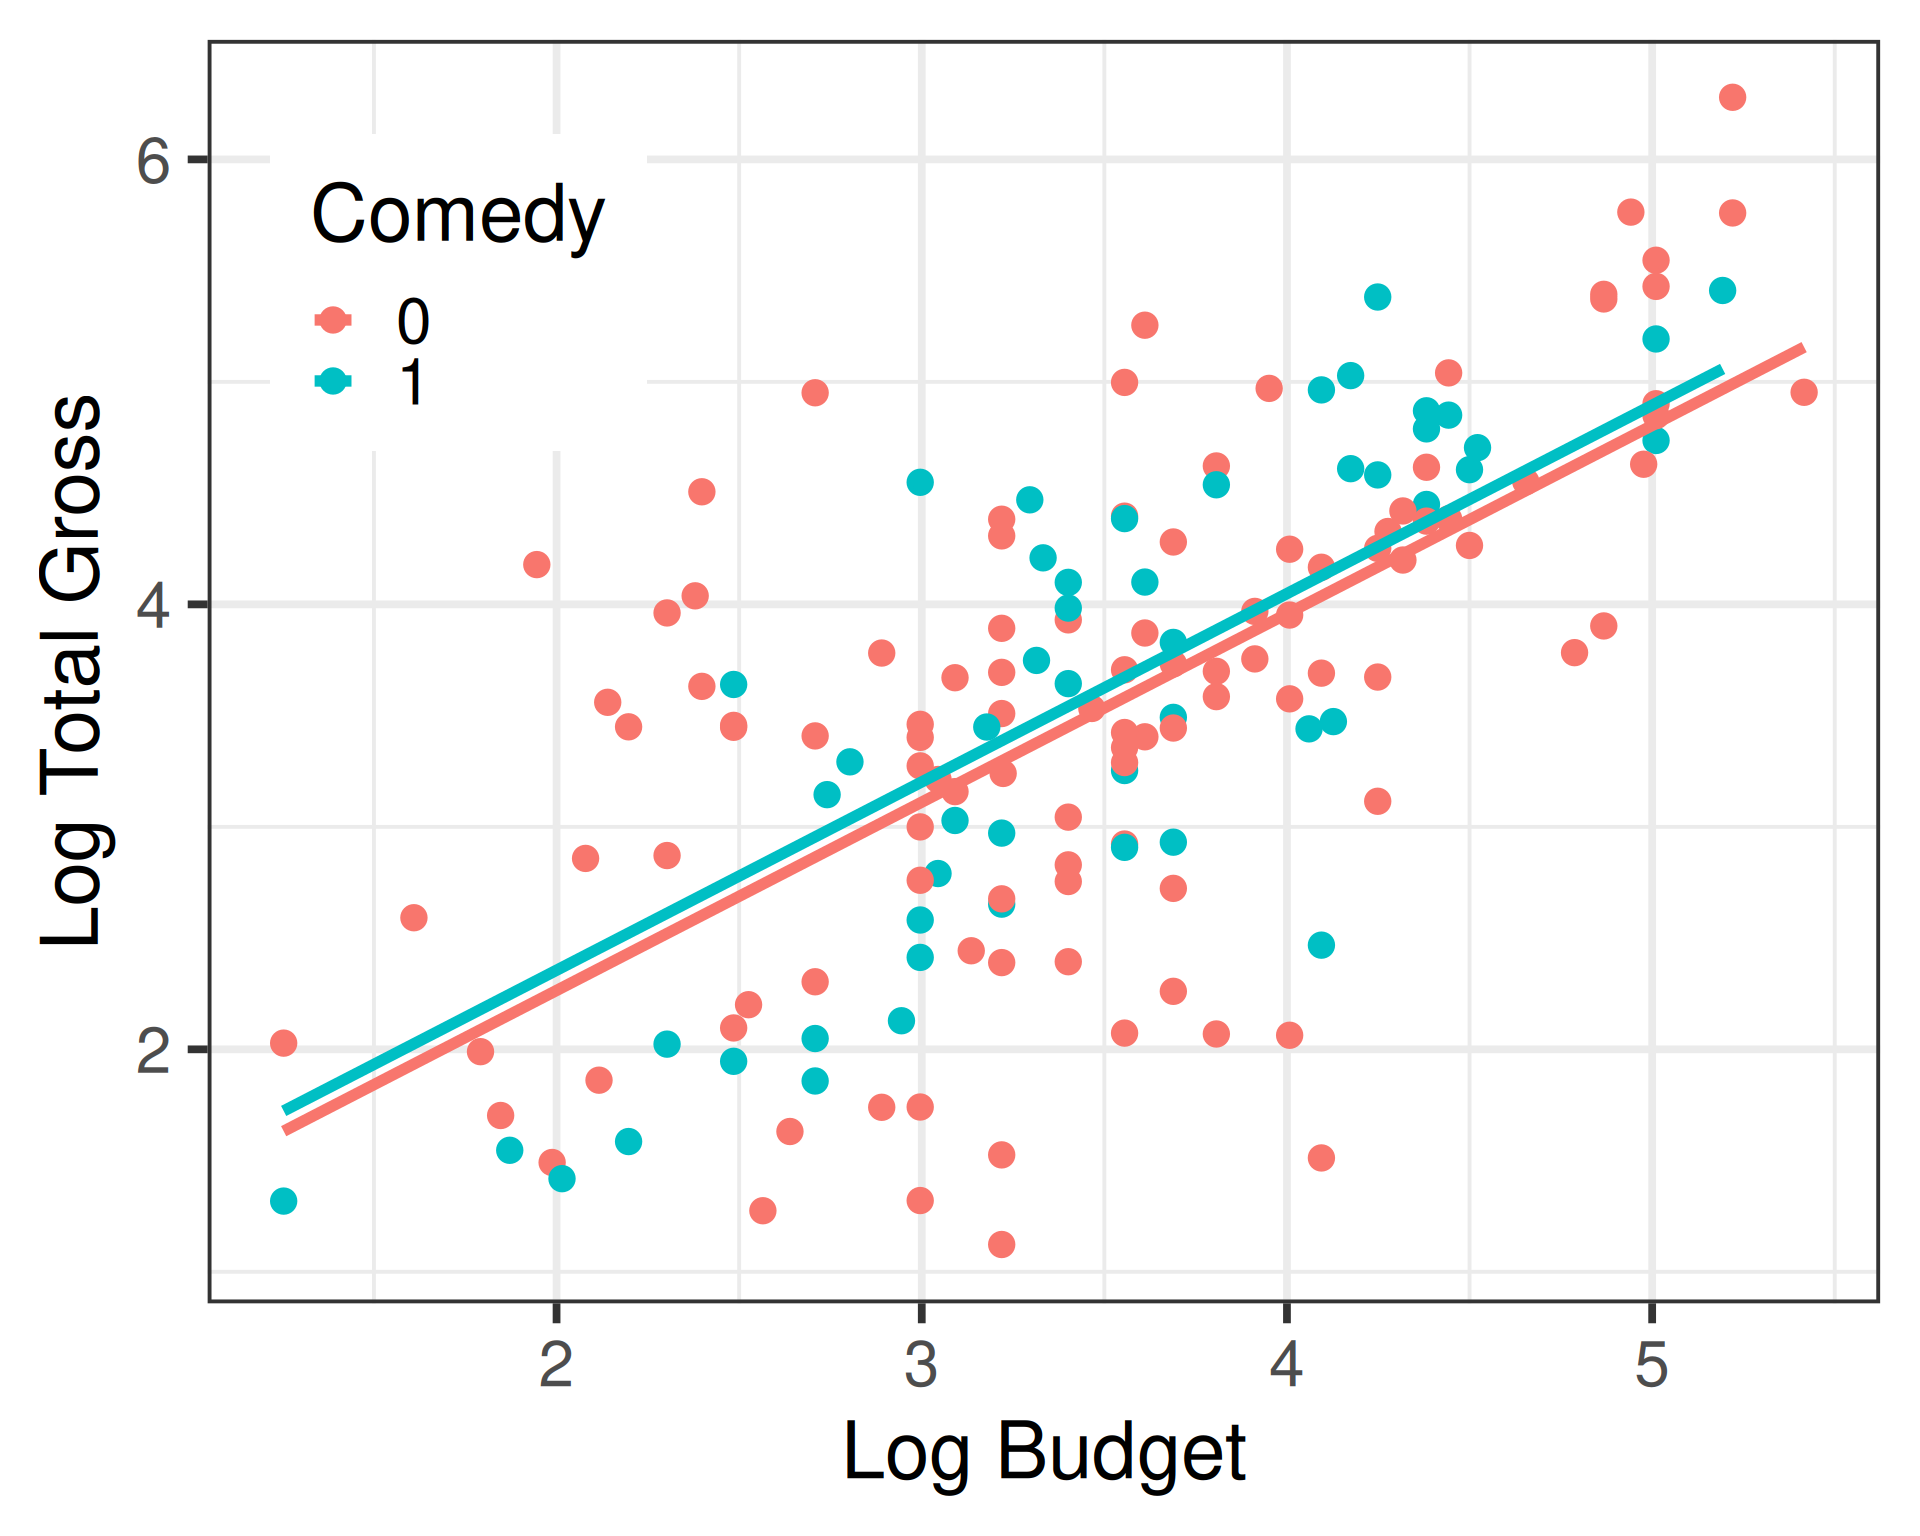
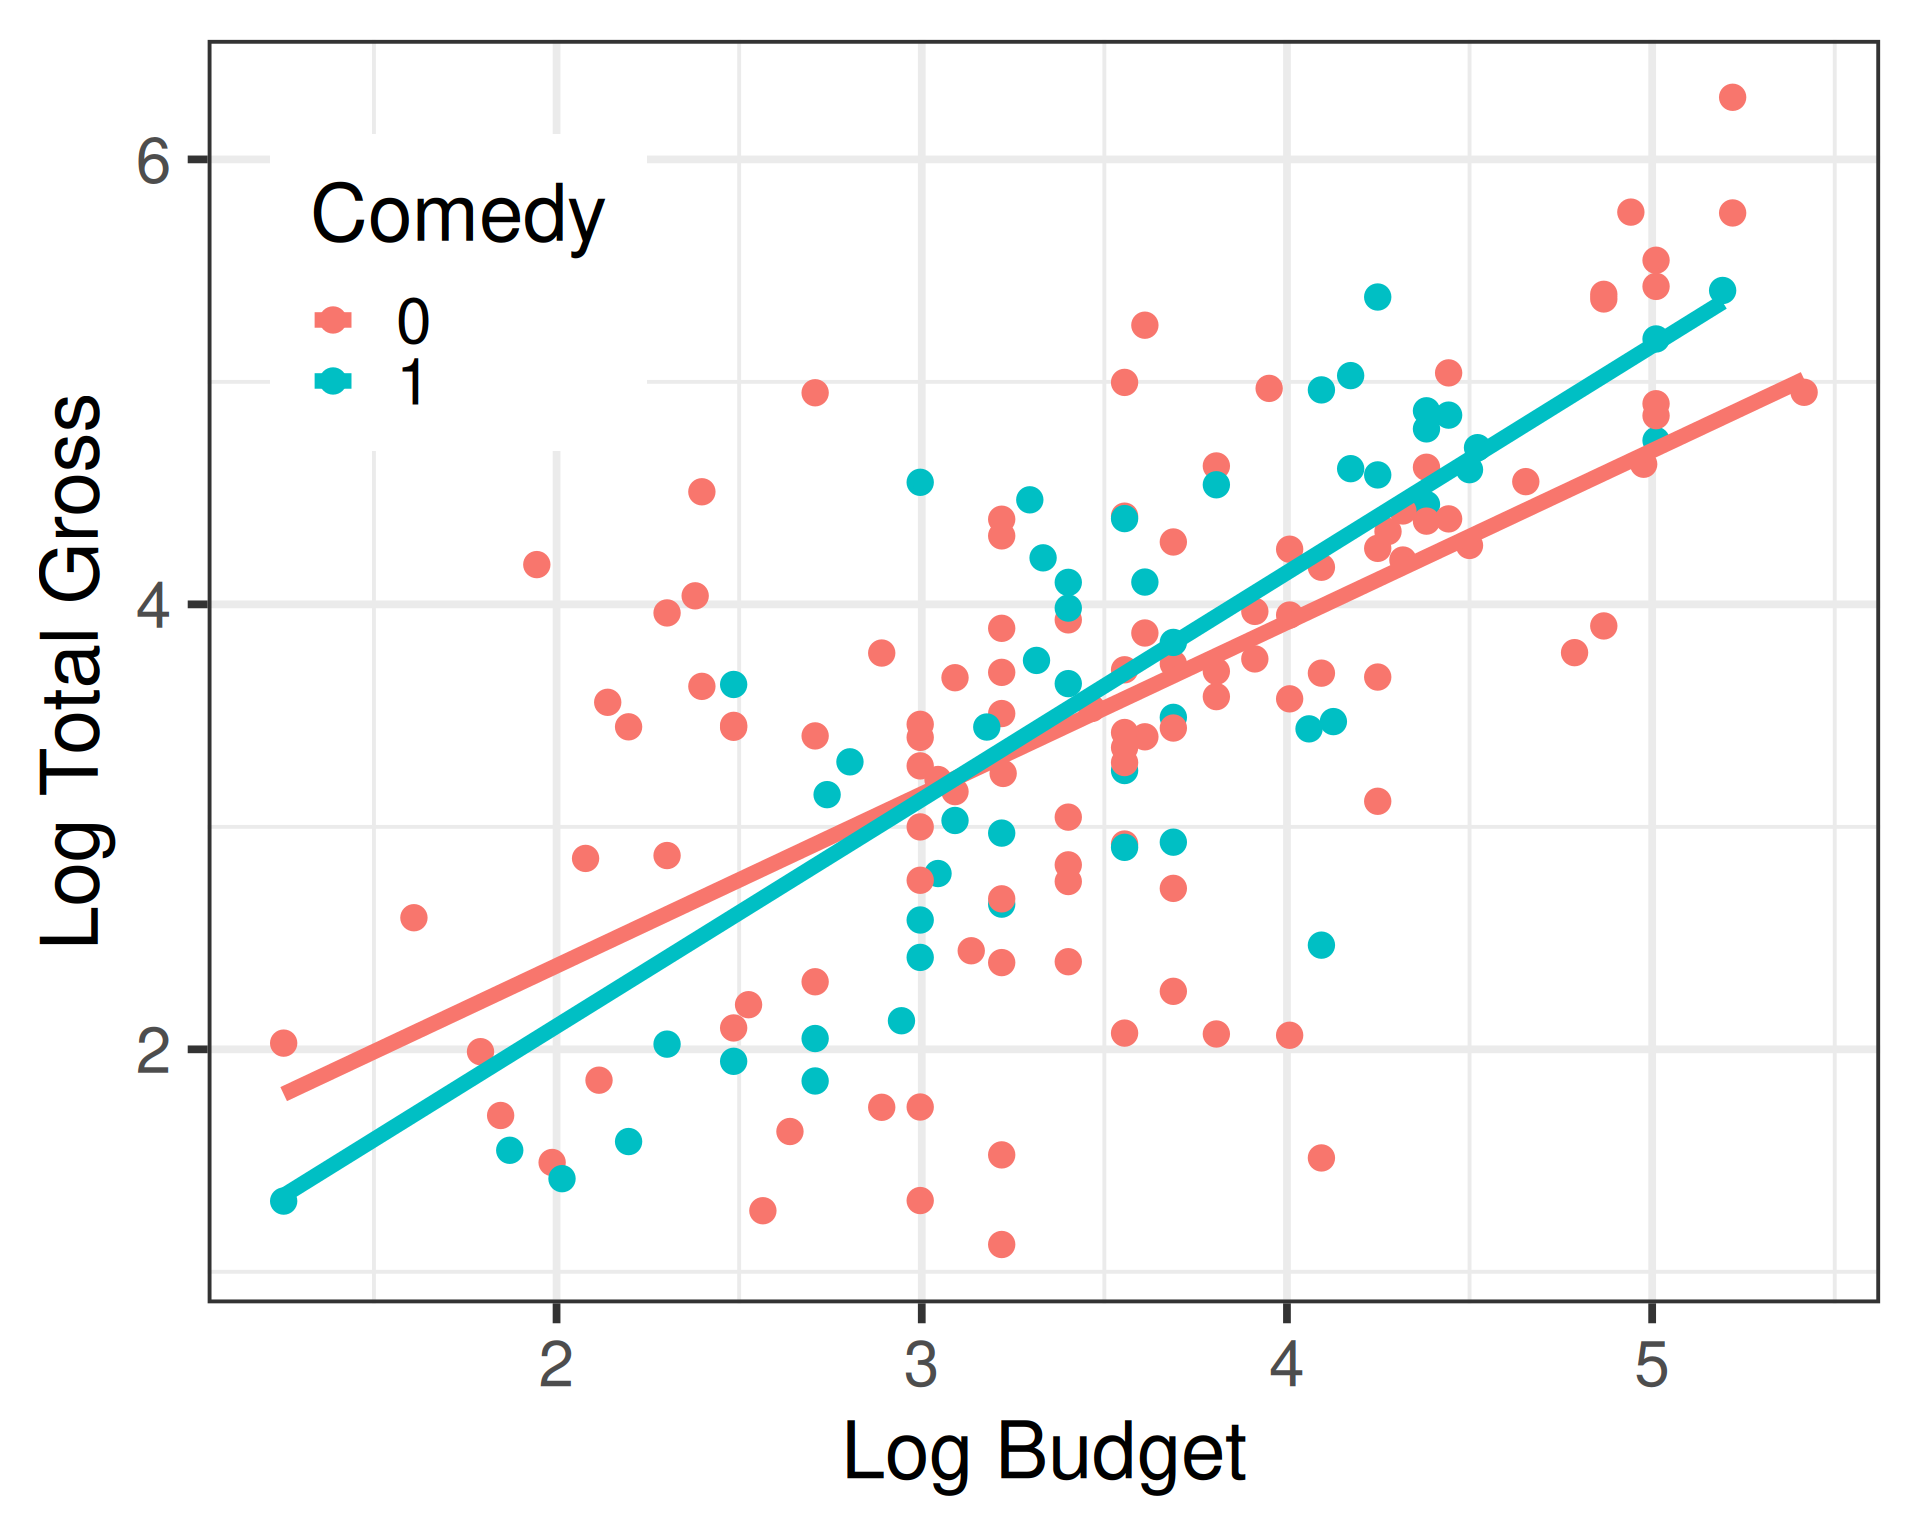
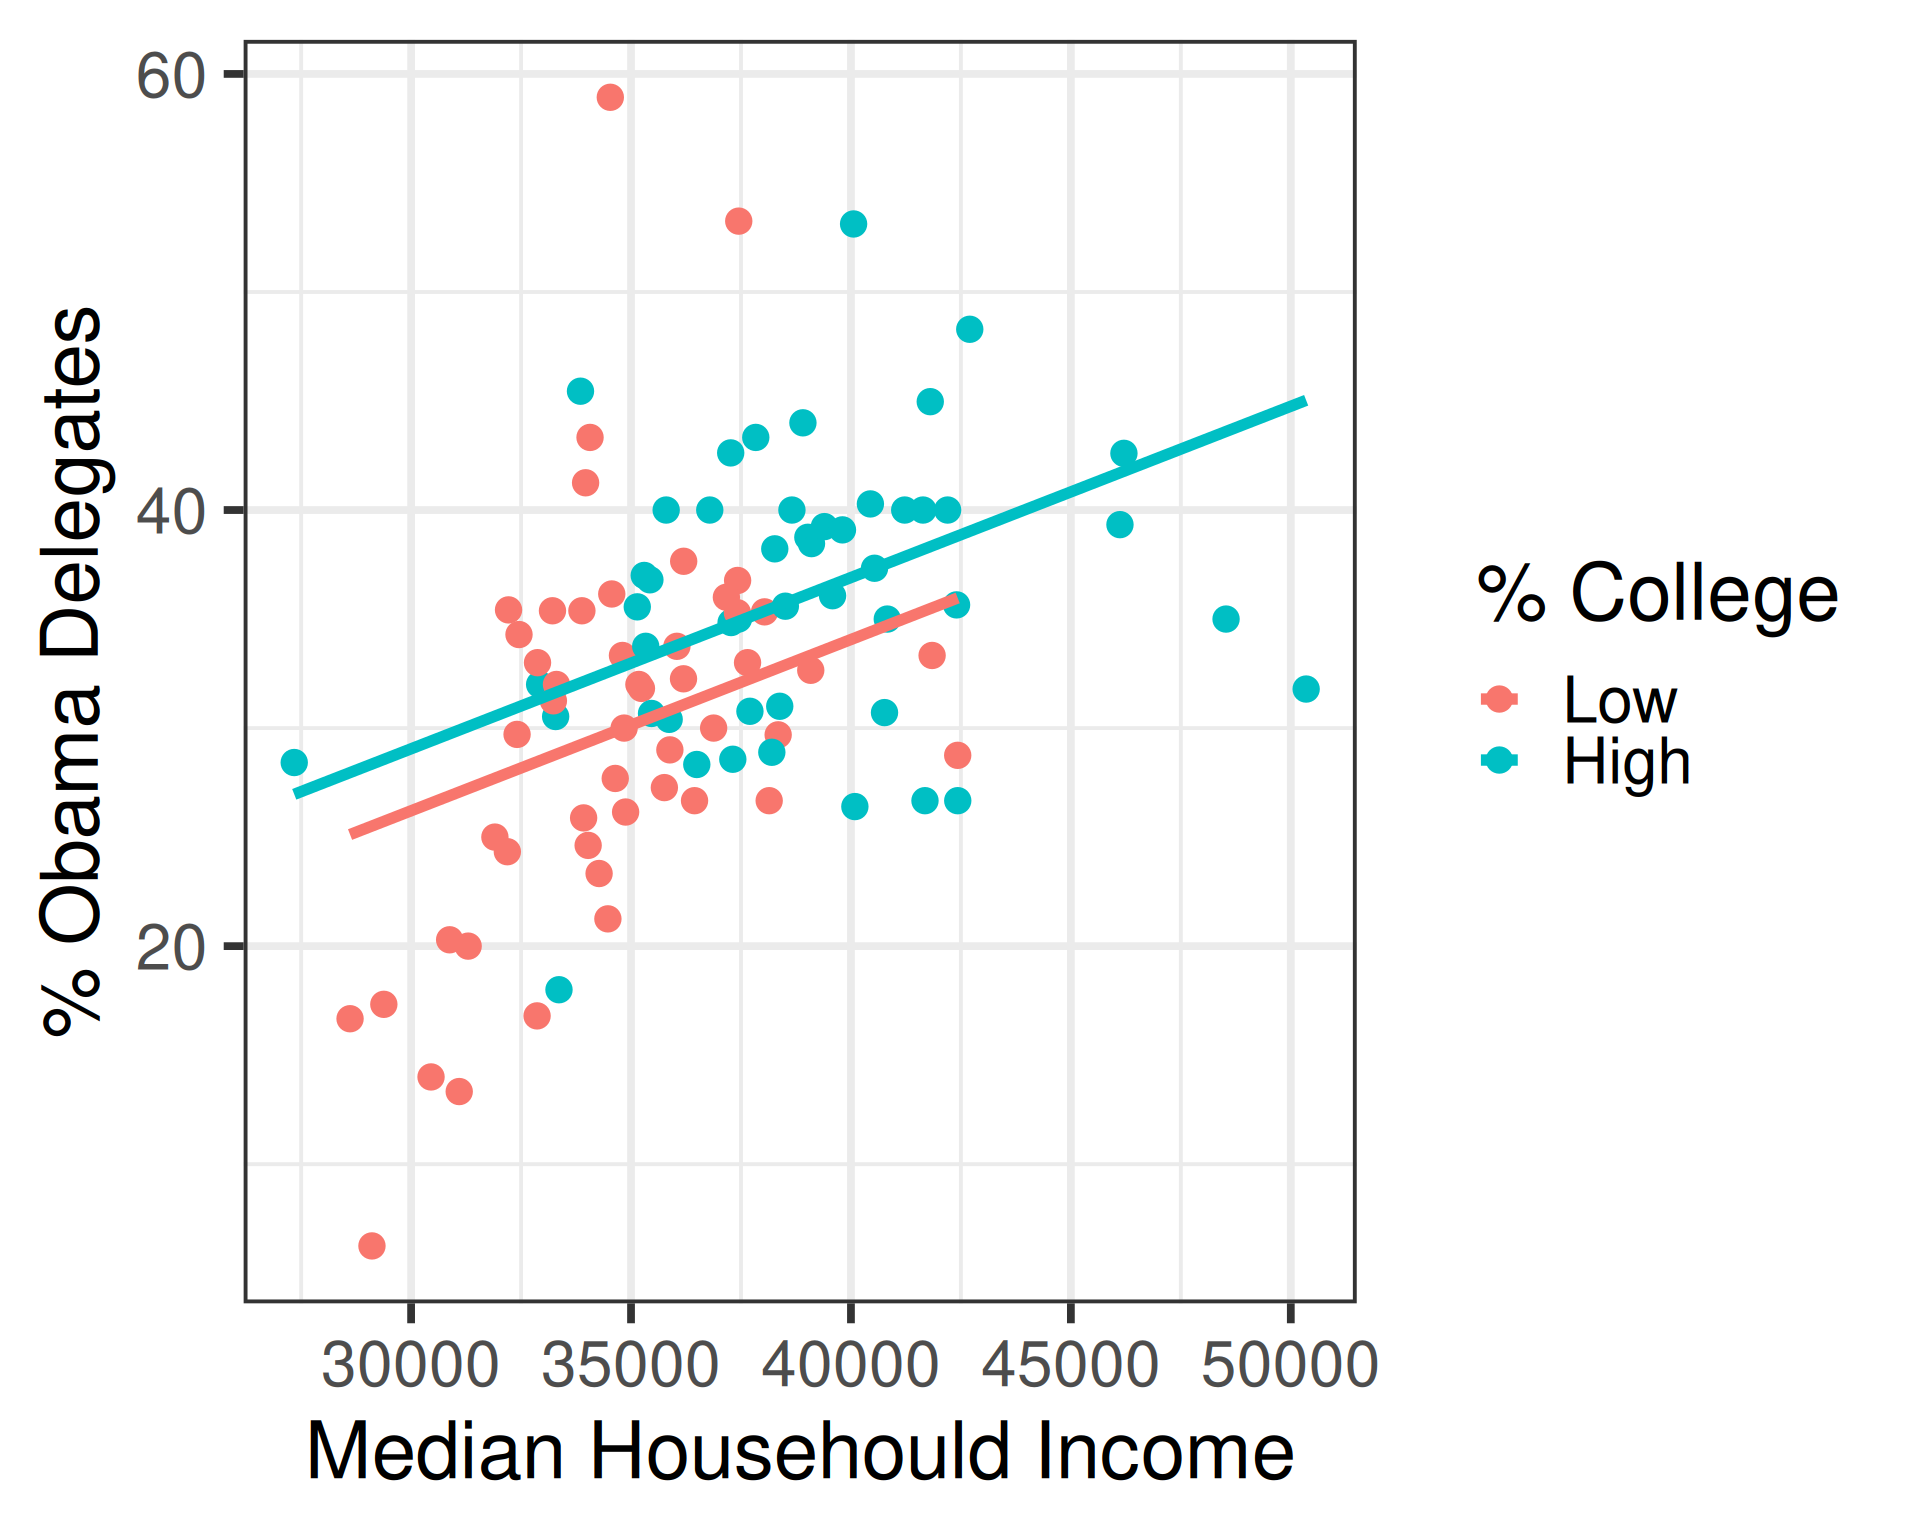
What if we wanted to allow for the possibility that the relationship between bill length and bill depth is different for different species?
- Interaction: when the association between one explanatory variable and the response depends on the value of another explanatory variable
Ex: Movie budgets
- the relationship between budget and earnings differs depending on the genre of the movie
Ex: Political support and education
- relationship between income and support for Sen. Obama in 2008 Iowa caucuses differs by educational attainment
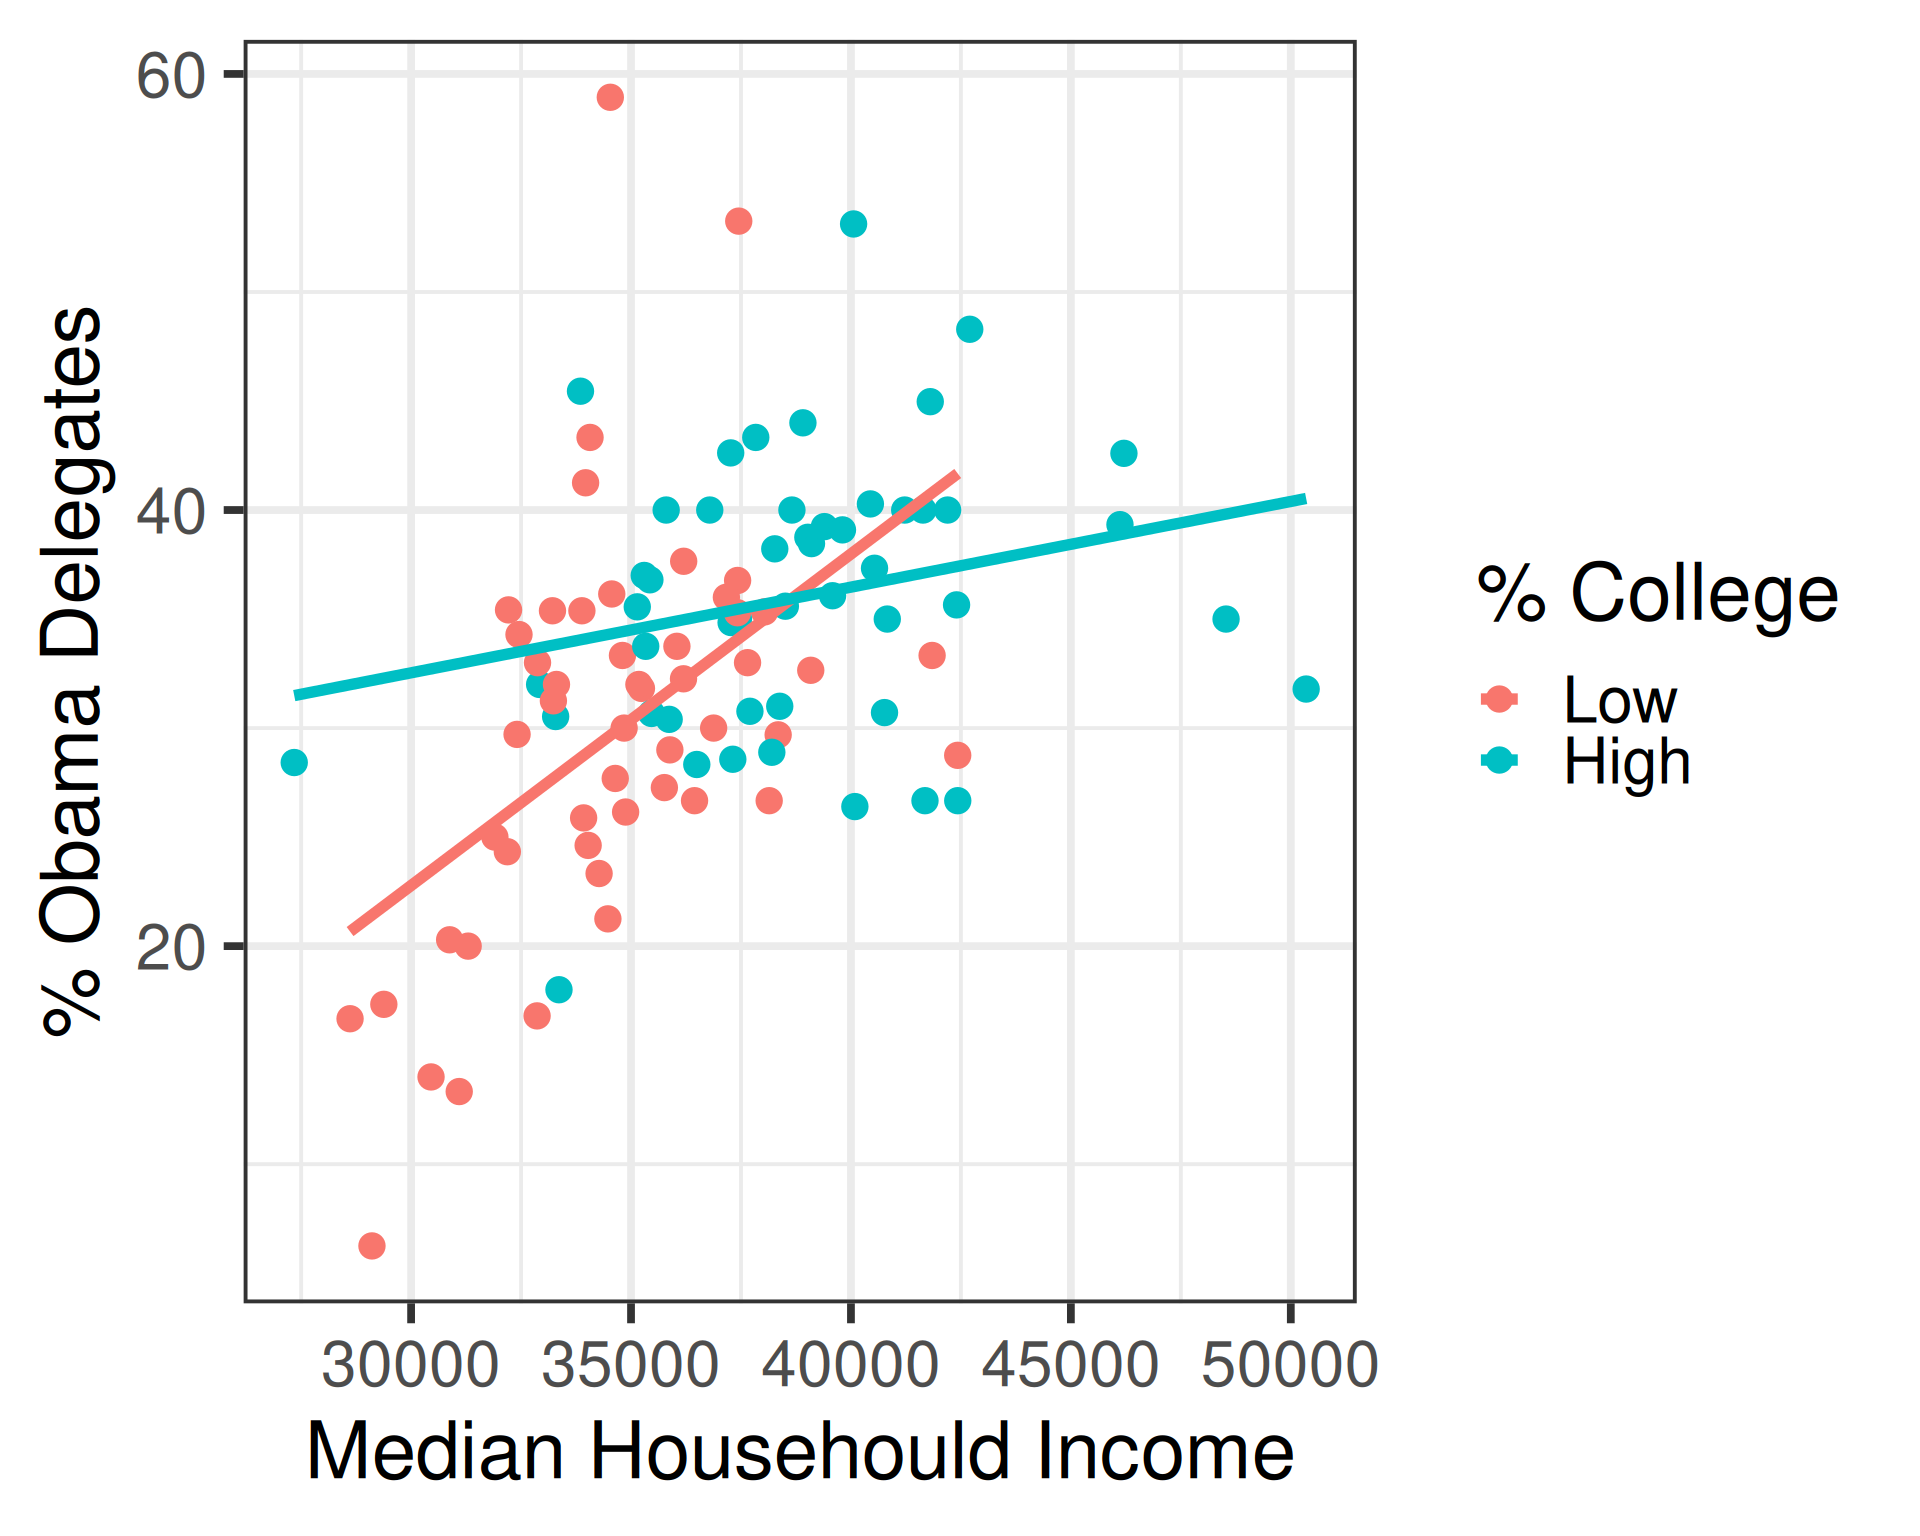
Interaction models
General Interaction Model for the Mean
\[ \mathbb{E}[Y|x_1, x_2] = \beta_0 + \beta_1 x_1 + \beta_2 x_2 + \underbrace{\beta_3 x_1 x_2}_{\text{interaction}} \]
- Expected change in response for one unit increase in \(x_1\) depends on \(x_2\): \[ \mathbb{E}[Y|x_1, x_2] = \beta_0 + \beta_2x_2 + (\beta_1 + \beta_3 x_2) x_1 \]
- And the expected change in response for a one unit increase in \(x_2\) depends on \(x_1\): \[\mathbb{E}[Y|x_1, x_2] = \beta_0 + \beta_1x_1 + (\beta_2 + \beta_3 x_1) x_2\]
Interaction with categorical variables
\[\begin{align*} \mathbb{E}[\texttt{depth}_i | \texttt{length}_i, \texttt{species}_i] &= \beta_0 + \beta_1\left(\texttt{length}_i\right) + \beta_2\left(\texttt{Adelie}_i\right) \\ &{\color{white}=} + \beta_3\left(\texttt{Gentoo}_i\right) + \beta_4\left(\texttt{length}_i\right) \left(\texttt{Adelie}_i\right) \\ &{\color{white}=} + \beta_5\left(\texttt{length}_i\right) \left(\texttt{Gentoo}_i\right) \end{align*}\]
- Relationship for Chinstrap penguins (reference level) \[ \mathbb{E}[\texttt{depth}_i | \texttt{length}_i, \texttt{species}_i = \text{Chinstrap}] = \beta_0 + \beta_1 \left(\texttt{length}_i\right)\]
- Relationship for Adelie penguins \[ \mathbb{E}[\texttt{depth}_i | \texttt{length}_i, \texttt{species}_i = \text{Adelie}] = (\beta_0 + \beta_2) + (\beta_1 + \beta_4)\left(\texttt{length}_i\right)\]
- Relationship for Gentoo penguins \[ \mathbb{E}[\texttt{depth}_i | \texttt{length}_i, \texttt{species}_i = \text{Gentoo}] = (\beta_0 +\beta_3) + (\beta_1 + \beta_5)\left(\texttt{length}_i\right)\]
Fitting interaction models in R
Interaction is multiplicative, so simply change the model formulation from addition sign (+) to multiplication sign (*):
Call:
lm(formula = bill_depth_mm ~ bill_length_mm * species, data = penguins)

Residuals:
    Min      1Q  Median      3Q     Max
-2.6574 -0.6675 -0.0524  0.5383  3.5032

Coefficients:
                             Estimate Std. Error t value Pr(>|t|)
(Intercept)                   7.56914    1.70983   4.427 1.29e-05 ***
bill_length_mm                0.22221    0.03493   6.361 6.55e-10 ***
speciesAdelie                 3.83998    2.05398   1.870   0.0624 .
speciesGentoo                -2.31813    2.16945  -1.069   0.2860
bill_length_mm:speciesAdelie -0.04338    0.04558  -0.952   0.3419
bill_length_mm:speciesGentoo -0.01737    0.04480  -0.388   0.6985
---
Signif. codes:  0 '***' 0.001 '**' 0.01 '*' 0.05 '.' 0.1 ' ' 1

Residual standard error: 0.9548 on 336 degrees of freedom
  (2 observations deleted due to missingness)
Multiple R-squared:  0.7697,    Adjusted R-squared:  0.7662
F-statistic: 224.5 on 5 and 336 DF,  p-value: < 2.2e-16
Aside: Four ways to describe a model
- Mathematical equation
- Line of R code
- Visualization of model in data space
- Verbal interpretation
Model specification
- Mathematical equation:
\[\begin{align*} \widehat{\texttt{depth}}_i &= 7.57 + 0.22\left(\texttt{length}_i\right) + 3.84\left(\texttt{Adelie}_i\right) -2.32\left(\texttt{Gentoo}_i\right) \\ &{\color{white}=} - 0.04\left(\texttt{length}_i\right)\left(\texttt{Adelie}_i\right) - 0.01\left(\texttt{length}_i\right)\left(\texttt{Gentoo}\right) \end{align*}\]
3. Visualize model in data space
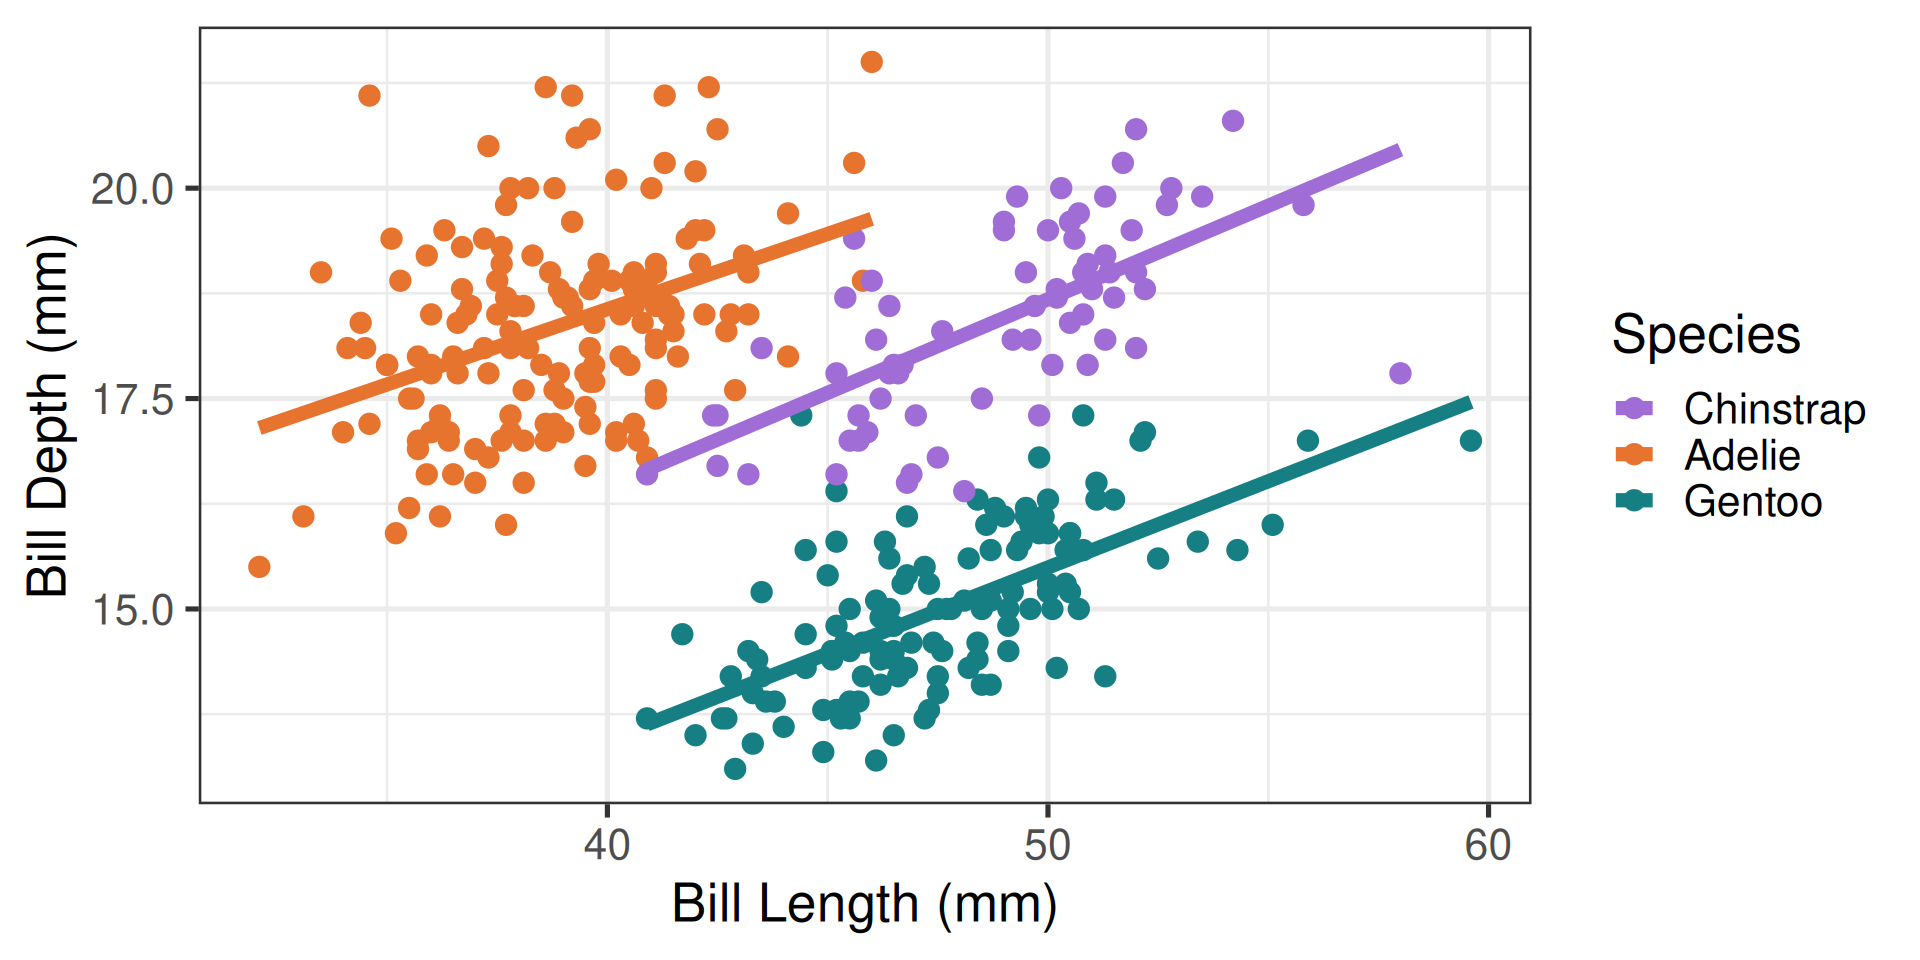
Verbal interpretations (ref. level)
- The intercept term (\(\widehat{\beta}_0\)) represents the \(y\)-axis intercept for the reference group:
- In context: the mean bill depth of a Chinstrap penguin with a bill length of 0 mm is 7.57 mm.
- The length coefficient (\(\widehat{\beta}_1\)) represents the slope for the reference group:
- In context: among Chinstrap penguins, a one mm increase in bill length is associated with a 0.22 mm increase in the mean bill depth
Verbal interpretations (main effects)
- The coefficient for the “main effect” of Adelie (\(\widehat{\beta}_2\)) represents the change in the \(y\)-intercept for Adelie penguins relative to the reference group:
- In context: among penguins with a bill length of 0 mm, the mean bill depth of an Adelie penguin is 3.84 mm greater than that of a Chinstrap penguin
- The coefficient for the “main effect” of Gentoo (\(\widehat{\beta}_3\)) represents the change in the \(y\)-intercept for Gentoo penguins relative to the reference group:
- In context: among penguins with a bill length of 0 mm, the average bill depth of an Gentoo penguin is 2.32 mm smaller than that of a Chinstrap penguin
Verbal interpretations (interaction)
- The first interaction term (\(\widehat{\beta}_4\)) represents the change in slope for Adelie penguins relative to the reference group:
- In context: for each one mm increase in bill length, the mean bill depth of an Adelie penguin increases by 0.04 mm less than does the mean bill depth of a Chinstrap penguin
- The second interaction term (\(\widehat{\beta}_5\)) represents the change in slope for Gentoo penguins relative to the reference group:
- In context: for each one mm increase in bill length, the mean bill depth of a Gentoo penguin increases by 0.01 mm less than does the mean bill depth of a Chinstrap penguin
Summary: additive models
- Additive models: make more assumptions about the relationships between the variables, but are easier to interpret as a result
- One slope (and thus one common relationship) for bill length and bill depth across all penguin species
- One set of slopes (and thus one set of common differences) for the mean bill depth between species across all different bill lengths
Summary: interaction models
Interaction models: make fewer assumptions, but the effect of one variable in the model is no longer captured by a single coefficient
The association between bill length and bill depth depends on species: \[ \text{Slope for length: } \left( 0.22 - 0.04\left(\texttt{Adelie}_i \right) - 0.01 \left( \texttt{Gentoo}_i \right) \right) \left( \texttt{length}_i \right) \]
And the differences in mean bill depth between the species depend on the bill length: \[\begin{align*} \text{Slope for Adelie indicator:}& \left( 3.84 - 0.04 \left(\texttt{length}_i\right) \right) \left(\texttt{Adelie}_i\right) \\ \text{Slope for Gentoo indicator:}& \left( -2.32 - 0.01 \left(\texttt{length}_i\right) \right) \left(\texttt{Gentoo}_i\right) \end{align*}\]
Interaction models
Interpretations for interaction models not only need to hold the other variable in the interaction constant, but need to specify at which value it is being held constant:
- Ex: Among Gentoo penguins, a one mm increase in bill length is associated with a 0.21 mm increase in mean bill depth \[\text{Scratch work: } 0.22 - 0.04(0) - 0.01(1) = 0.21\]
- Ex: The mean bill depth of Adelie penguins with a 42 mm long bill is 2.16 mm greater than the mean bill depth of Chinstrap penguins with the same bill length \[\text{Scratch work: } 3.84 - 0.04(42) = 2.16\]
Discussion
Please discuss each of the following with a partner or two! Be prepared to share your thoughts with the group!
Food for Thought
- Given the extra work required to fit and interpret an interaction model for the Palmer penguins data, why not just fit three separate lines and be done with it?
- When (and why) might we prefer an additive model to an interaction model (and vice versa)?

SDS 291