class: center, middle, inverse, title-slide # Data visualization ## Graphical integrity ### Ben Baumer ### SDS 192</br>Sep 9, 2020</br>(<a href="http://beanumber.github.io/sds192/lectures/mdsr_viz_02-tufte.html" class="uri">http://beanumber.github.io/sds192/lectures/mdsr_viz_02-tufte.html</a>) --- ## [A misleading chart from Apple](https://qz.com/122921/the-chart-tim-cook-doesnt-want-you-to-see/)  --- ## Pie charts (just don't) .footnote[https://en.wikipedia.org/wiki/Misleading_graph#Pie_chart] .pull-left[ <!-- --> ] -- .pull-right[ 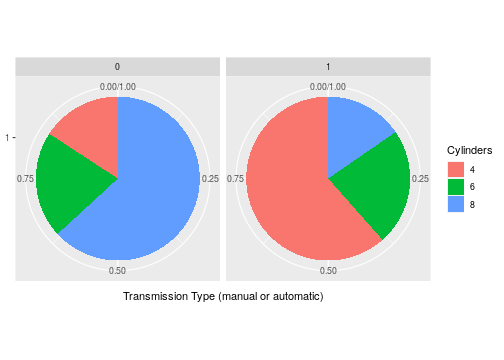<!-- --> ] -- - Are 6-cylinder engines more common among manuals or automatics? --- ## Scales .footnote[https://infovis-wiki.net/wiki/Lie_Factor] .pull-left[ 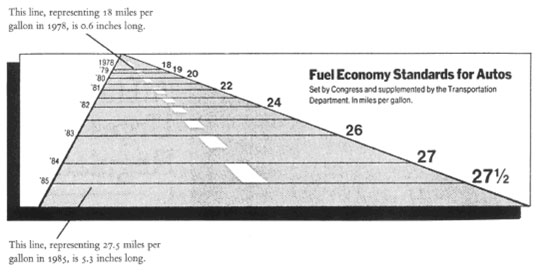 - Often not very clearly defined - Easy to lie by manipulating scales - Why perspective? - Width of lines? ] -- .pull-right[ 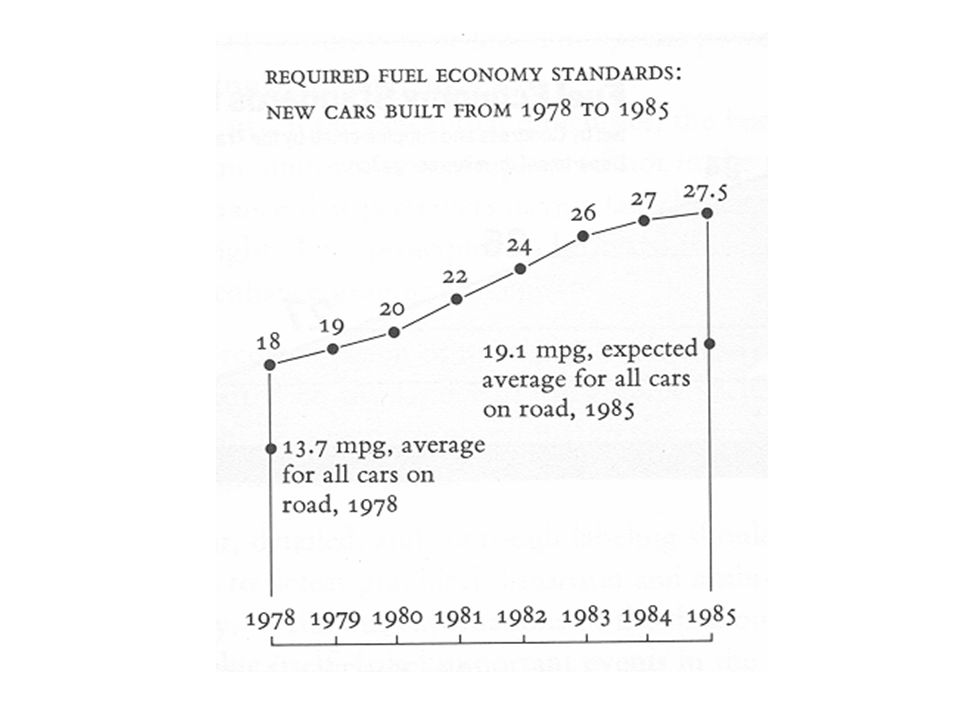 - Good graphics have clear scales - Remember iPhone sales graphic ] --- .footnote[https://en.wikipedia.org/wiki/Misleading_graph#Improper_scaling] .center[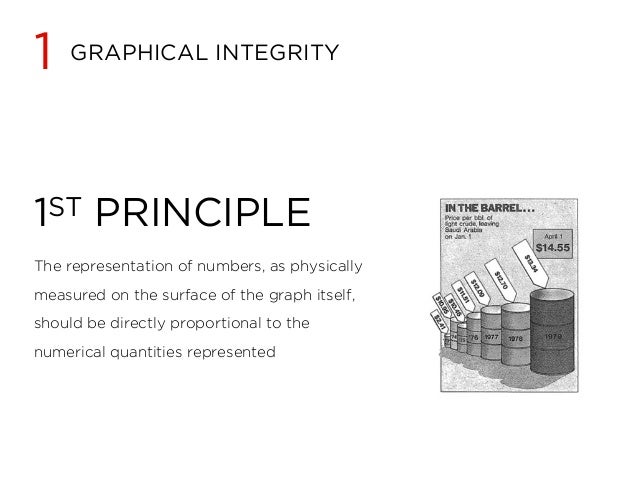] --- .footnote[https://en.wikipedia.org/wiki/Misleading_graph#3D] .center[] --- .footnote[https://en.wikipedia.org/wiki/Chartjunk] .center[] --- ## Balance of art vs. science .pull-left[ Data graphics: - purpose is to convey meaning - scientific, rigorous - peer-reviewed - clear - **creative!** ] -- .pull-right[ [Infographics](https://en.wikipedia.org/wiki/Infographic): - purpose might be to draw eyeballs - entertaining? - sales or marketing? - public sphere - creative ] -- - We're only interested in the former