class: center, middle, inverse, title-slide # Data wrangling ## Tidy data ### Ben Baumer ### SDS 192</br>Oct 5, 2020</br>(<a href="http://beanumber.github.io/sds192/lectures/mdsr_wrangling_06-tidyr.html" class="uri">http://beanumber.github.io/sds192/lectures/mdsr_wrangling_06-tidyr.html</a>) --- class: center, middle, inverse  --- ## Second normal form .center[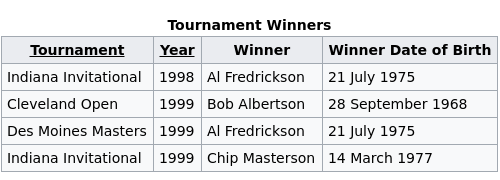] - E.F. Codd (1971) - This table is about **tournaments** - `Winner Date of Birth` is a fact about a **person** - it's redundant - it belongs in a table about people --- ## [Third normal form](https://en.wikipedia.org/wiki/Third_normal_form) .center[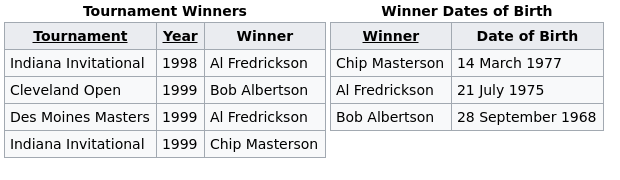] - "Like is stored with like" - No redundant information - Tables tend to be: - Long (many rows) - Narrow (few columns) - Efficient in terms of both storage and retrieval speed - Not that useful if you don't know how to join! - What is the average age (in years) of a tournament winner? --- ## Tidy data: [Wickham (2014)](http://vita.had.co.nz/papers/tidy-data.pdf) .center[] --- ## Why tidy data? ```r library(tidyverse) library(fivethirtyeight) drugs <- drug_use %>% mutate(age_min = parse_number(levels(age))) %>% select(age_min, alcohol_use, marijuana_use, cocaine_use) drugs ``` ``` ## # A tibble: 17 x 4 ## age_min alcohol_use marijuana_use cocaine_use ## <dbl> <dbl> <dbl> <dbl> ## 1 12 3.9 1.1 0.1 ## 2 13 8.5 3.4 0.1 ## 3 14 18.1 8.7 0.1 ## 4 15 29.2 14.5 0.5 ## 5 16 40.1 22.5 1 ## 6 17 49.3 28 2 ## 7 18 58.7 33.7 3.2 ## 8 19 64.6 33.4 4.1 ## 9 20 69.7 34 4.9 ## 10 21 83.2 33 4.8 ## 11 22 84.2 28.4 4.5 ## 12 24 83.1 24.9 4 ## 13 26 80.7 20.8 3.2 ## 14 30 77.5 16.4 2.1 ## 15 35 75 10.4 1.5 ## 16 50 67.2 7.3 0.9 ## 17 65 49.3 1.2 0 ``` --- ## Cumbersome to plot ```r ggplot(data = drugs, aes(x = age_min)) + geom_line(aes(y = alcohol_use), color = "red") + geom_line(aes(y = marijuana_use), color = "green") + geom_line(aes(y = cocaine_use), color = "blue") ``` <!-- --> --- ## Example: countries over time ```r table4a ``` ``` ## # A tibble: 3 x 3 ## country `1999` `2000` ## * <chr> <int> <int> ## 1 Afghanistan 745 2666 ## 2 Brazil 37737 80488 ## 3 China 212258 213766 ``` - Not tidy because: - What are the variables? - Do the values measure the same kind of thing? --- ## `pivot_longer()`: make wide into narrow ```r table4a %>% pivot_longer(-country, names_to = "year", values_to = "cases") ``` .center[] --- ## Demo: *Frozen* longer ```r frozen ``` ``` ## # A tibble: 3 x 3 ## person sunday monday ## <chr> <chr> <chr> ## 1 Elsa happy sad ## 2 Anna happy happy ## 3 Kristoff afraid sad ``` -- ```r frozen %>% pivot_longer(-person, names_to = "day", values_to = "emotion") ``` ``` ## # A tibble: 6 x 3 ## person day emotion ## <chr> <chr> <chr> ## 1 Elsa sunday happy ## 2 Elsa monday sad ## 3 Anna sunday happy ## 4 Anna monday happy ## 5 Kristoff sunday afraid ## 6 Kristoff monday sad ``` --- ## Let's tidy up that approval data... ```r drugs_tidy <- drugs %>% pivot_longer( * cols = contains("_use"), names_to = "substance", values_to = "pct" ) drugs_tidy ``` ``` ## # A tibble: 51 x 3 ## age_min substance pct ## <dbl> <chr> <dbl> ## 1 12 alcohol_use 3.9 ## 2 12 marijuana_use 1.1 ## 3 12 cocaine_use 0.1 ## 4 13 alcohol_use 8.5 ## 5 13 marijuana_use 3.4 ## 6 13 cocaine_use 0.1 ## 7 14 alcohol_use 18.1 ## 8 14 marijuana_use 8.7 ## 9 14 cocaine_use 0.1 ## 10 15 alcohol_use 29.2 ## # … with 41 more rows ``` --- ## ...and now the plot is simple ```r ggplot(drugs_tidy, aes(x = age_min, y = pct, color = substance)) + geom_line() ``` 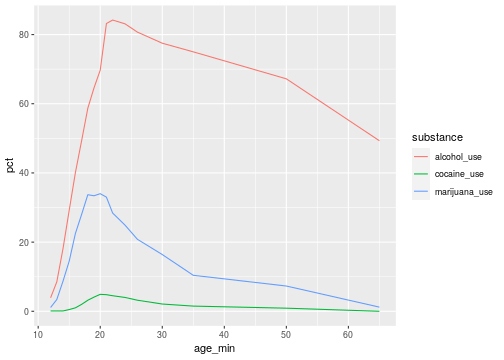<!-- --> --- ## Example: countries over time ```r head(table2) ``` ``` ## # A tibble: 6 x 4 ## country year type count ## <chr> <int> <chr> <int> ## 1 Afghanistan 1999 cases 745 ## 2 Afghanistan 1999 population 19987071 ## 3 Afghanistan 2000 cases 2666 ## 4 Afghanistan 2000 population 20595360 ## 5 Brazil 1999 cases 37737 ## 6 Brazil 1999 population 172006362 ``` - Not tidy because: - Are the counts comparable? --- ## `pivot_wider()`: make narrow into wide ```r table2 %>% pivot_wider(names_from = type, values_from = count) ``` ``` ## # A tibble: 6 x 4 ## country year cases population ## <chr> <int> <int> <int> ## 1 Afghanistan 1999 745 19987071 ## 2 Afghanistan 2000 2666 20595360 ## 3 Brazil 1999 37737 172006362 ## 4 Brazil 2000 80488 174504898 ## 5 China 1999 212258 1272915272 ## 6 China 2000 213766 1280428583 ``` .center[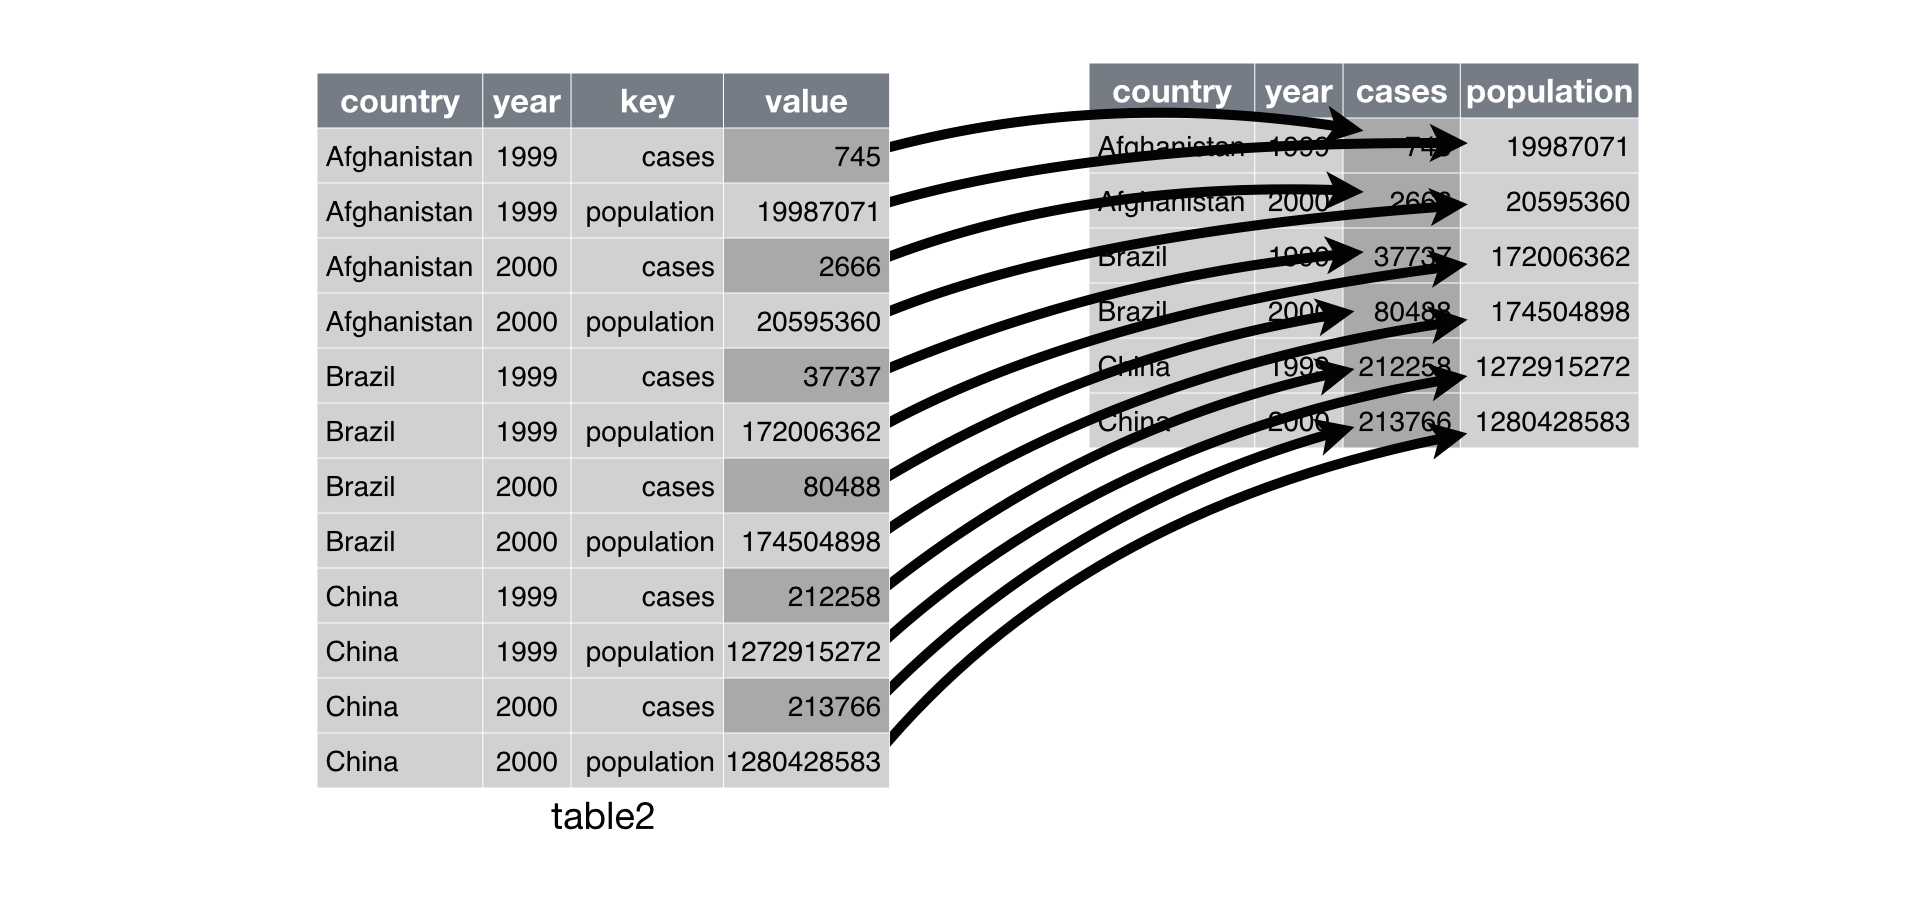] .footnote[https://github.com/hadley/r4ds/issues/544] --- ## Demo: *Frozen* wider ```r frozen_longer ``` ``` ## # A tibble: 6 x 3 ## person day emotion ## <chr> <chr> <chr> ## 1 Elsa sunday happy ## 2 Elsa monday sad ## 3 Anna sunday happy ## 4 Anna monday happy ## 5 Kristoff sunday afraid ## 6 Kristoff monday sad ``` -- ```r frozen_longer %>% pivot_wider(names_from = day, values_from = emotion) ``` ``` ## # A tibble: 3 x 3 ## person sunday monday ## <chr> <chr> <chr> ## 1 Elsa happy sad ## 2 Anna happy happy ## 3 Kristoff afraid sad ```