# A tibble: 2 × 4
habit num_births mean_weight sd_weight
<chr> <int> <dbl> <dbl>
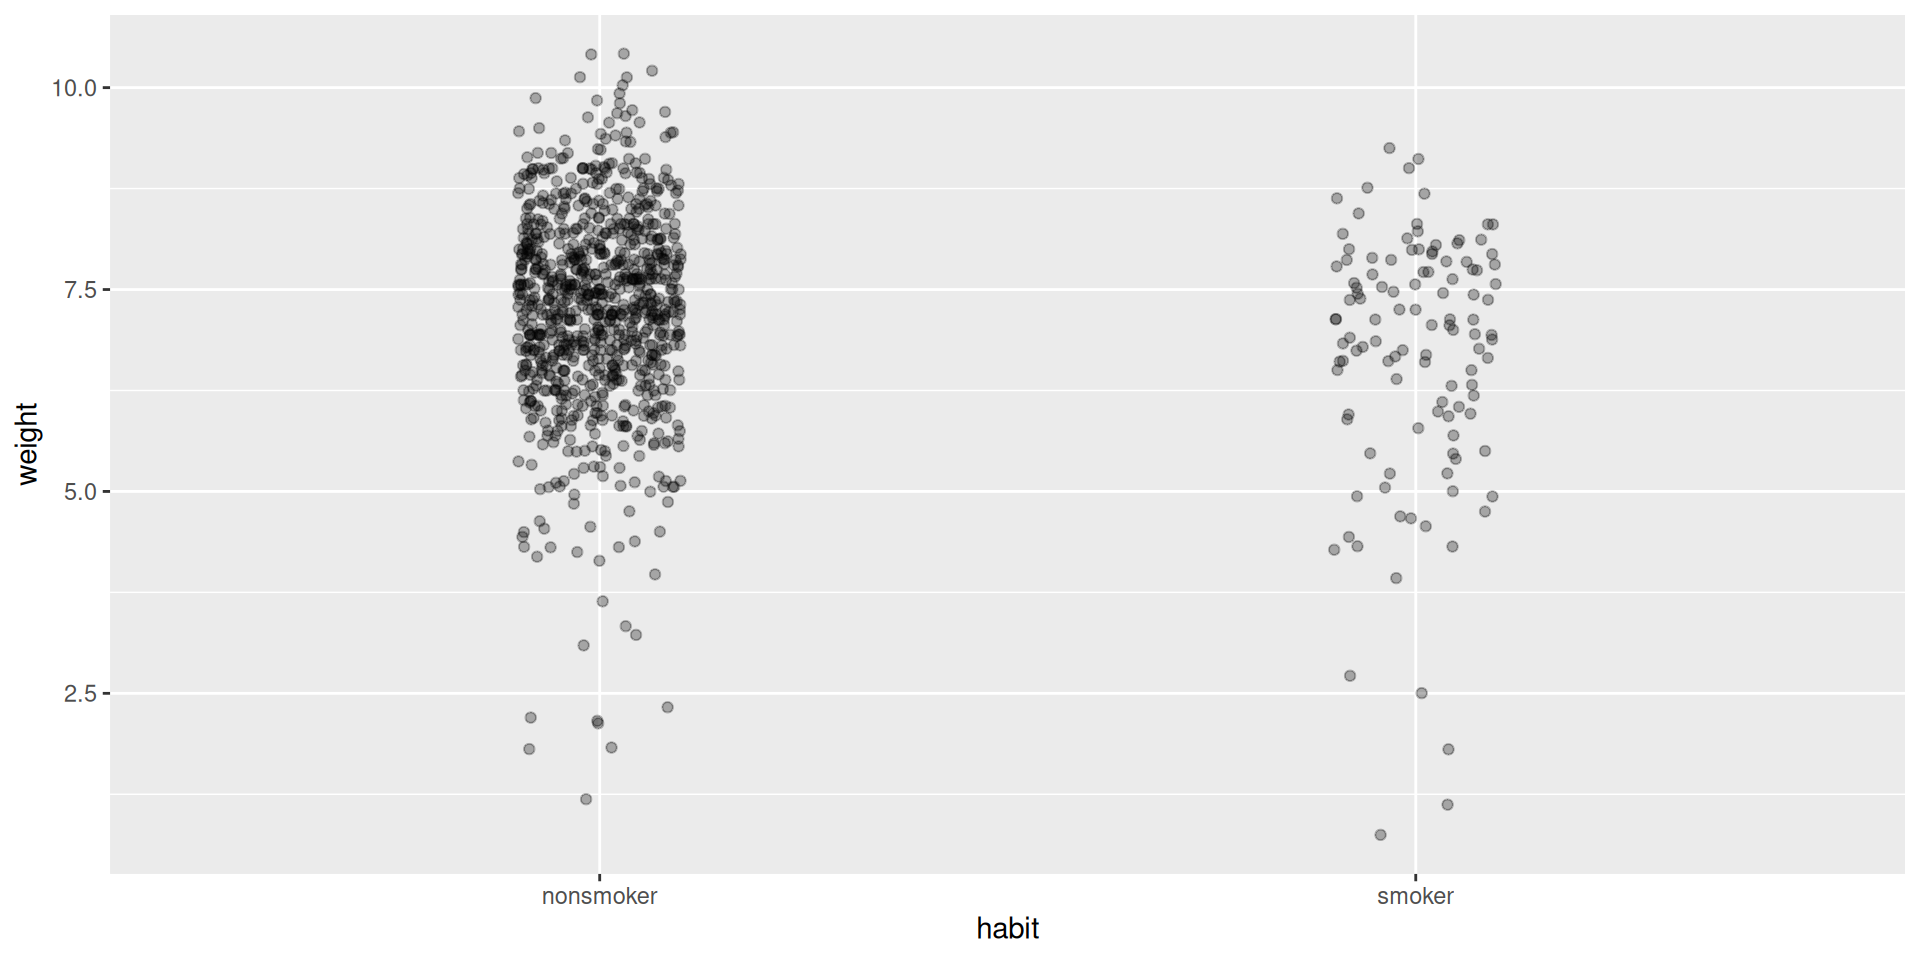
1 nonsmoker 867 7.27 1.23
2 smoker 114 6.68 1.60Inference for two means
IMS, Ch. 20
Smith College
Apr 17, 2026
Clarification
\(t\)-distribution only has one parameter
- \(t\)-distribution is like the Standard Normal
- always has mean 0
- standard deviation is “baked in”
- In a hypothesis test, use t-score (analogous to z-score): \[ T = \frac{\bar{x} - \mu_0}{SE_\bar{X}} = \frac{\bar{x} - \mu_0}{s_X / \sqrt{n}} \]
Inference for a difference in means
| Method | null dist. | sampling dist. |
|---|---|---|
| 1: probability | ?? | ?? |
| 2: simulation | randomization test | double bootstrap |
| 3: \(t\)-approx. | \(t \left( d.f. \right)\) | \(t \left( d.f. \right)\) |
- See IMS, Chapter 20
\(t\)-based approximation
- Standard error: \[ SE_{X_1, X_2} = \sqrt{SE_{X_1}^2 + SE_{X_2}^2} \]
- d.f. = \(min(n_1 - 1, n_2 - 1)\)
- test statistic: \[ T = \frac{(\bar{x}_1 - \bar{x}_2) - 0}{SE_{X_1, X_2}} \]
Birthweights
Every year, the US releases to the public a large data set containing information on births recorded in the country. This data set has been of interest to medical researchers who are studying the relation between habits and practices of expectant mothers and the birth of their children. This is a random sample of 1,000 cases from the data set released in 2014.
Observed statistics
- Is the observed difference meaningful?
Exploratory data analysis
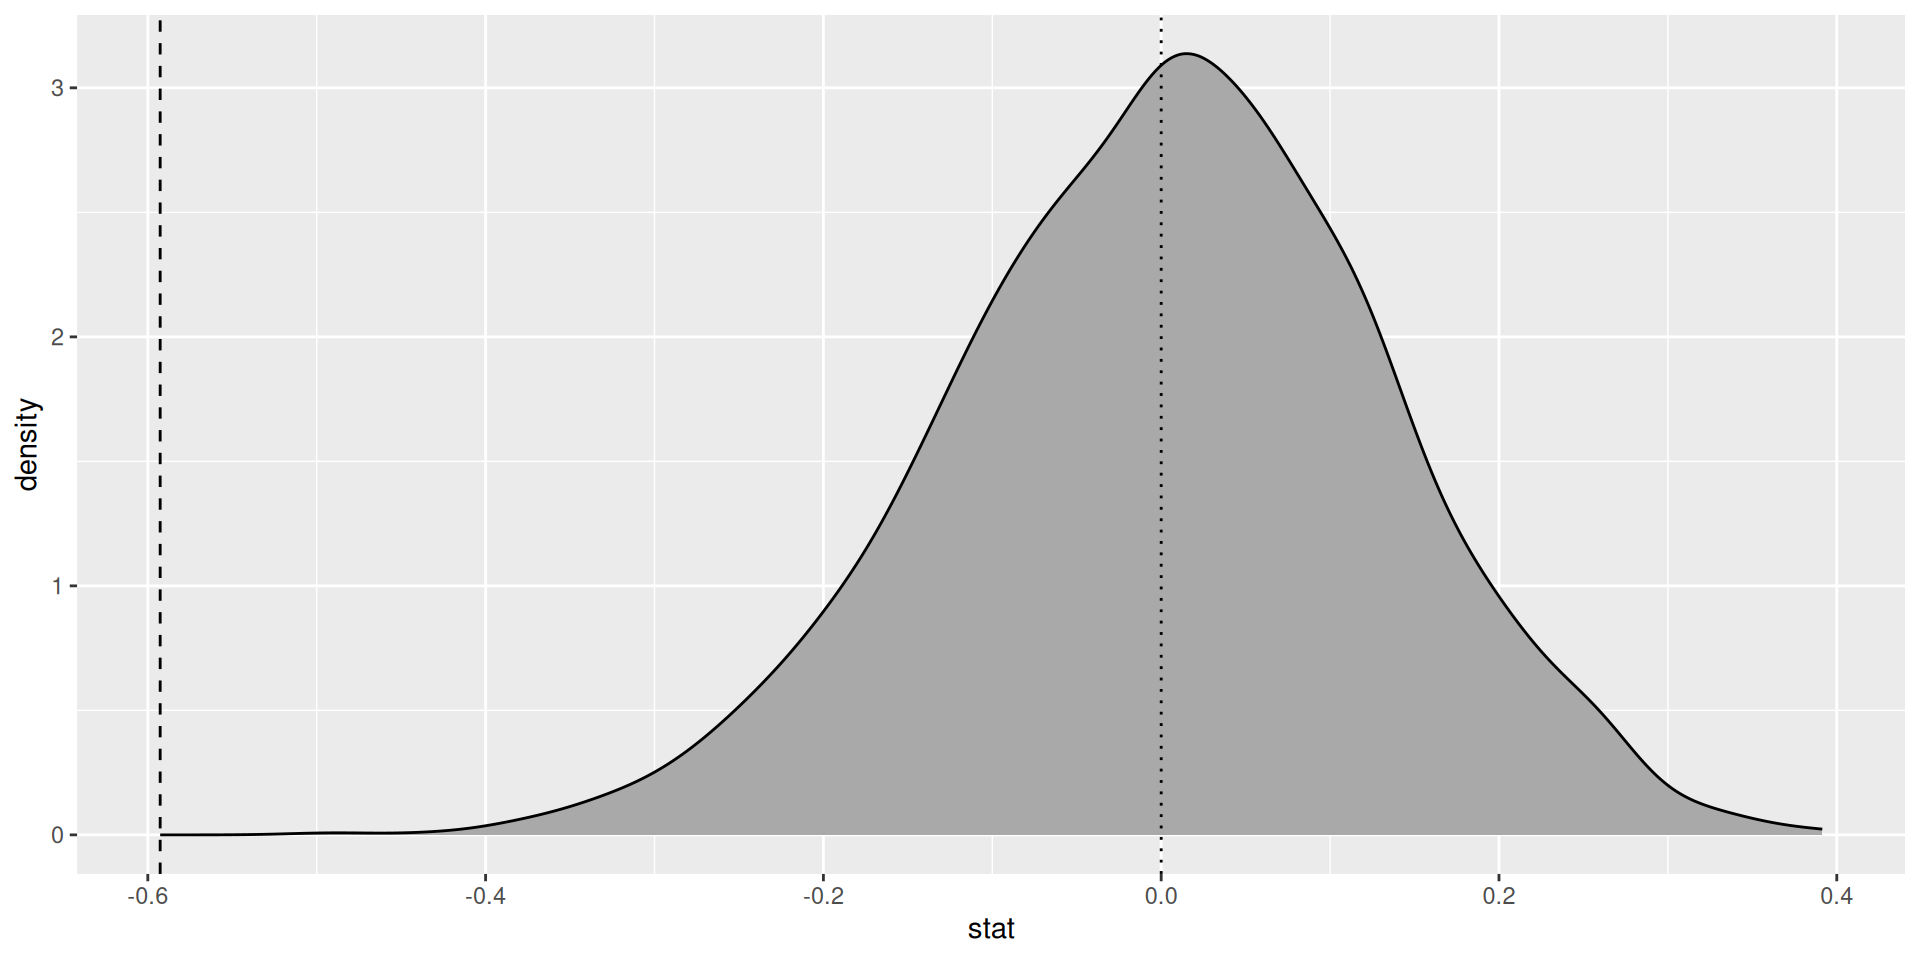
Randomization test
- Construct null distribution via randomization
Null distribution
Two-sample t-test
- Do it all in one step!
# A tibble: 1 × 7
  statistic  t_df  p_value alternative estimate lower_ci upper_ci
      <dbl> <dbl>    <dbl> <chr>          <dbl>    <dbl>    <dbl>
1 -3.82 131. 0.000208 two.sided -0.593 -0.900 -0.285- Classic version
    Welch Two Sample t-test

data:  weight by habit
t = 3.8166, df = 131.31, p-value = 0.0002075
alternative hypothesis: true difference in means between group nonsmoker and group smoker is not equal to 0
95 percent confidence interval:
 0.2854852 0.8998751
sample estimates:
mean in group nonsmoker    mean in group smoker
7.269873 6.677193 \(t\)-based approximation
Compare nulls
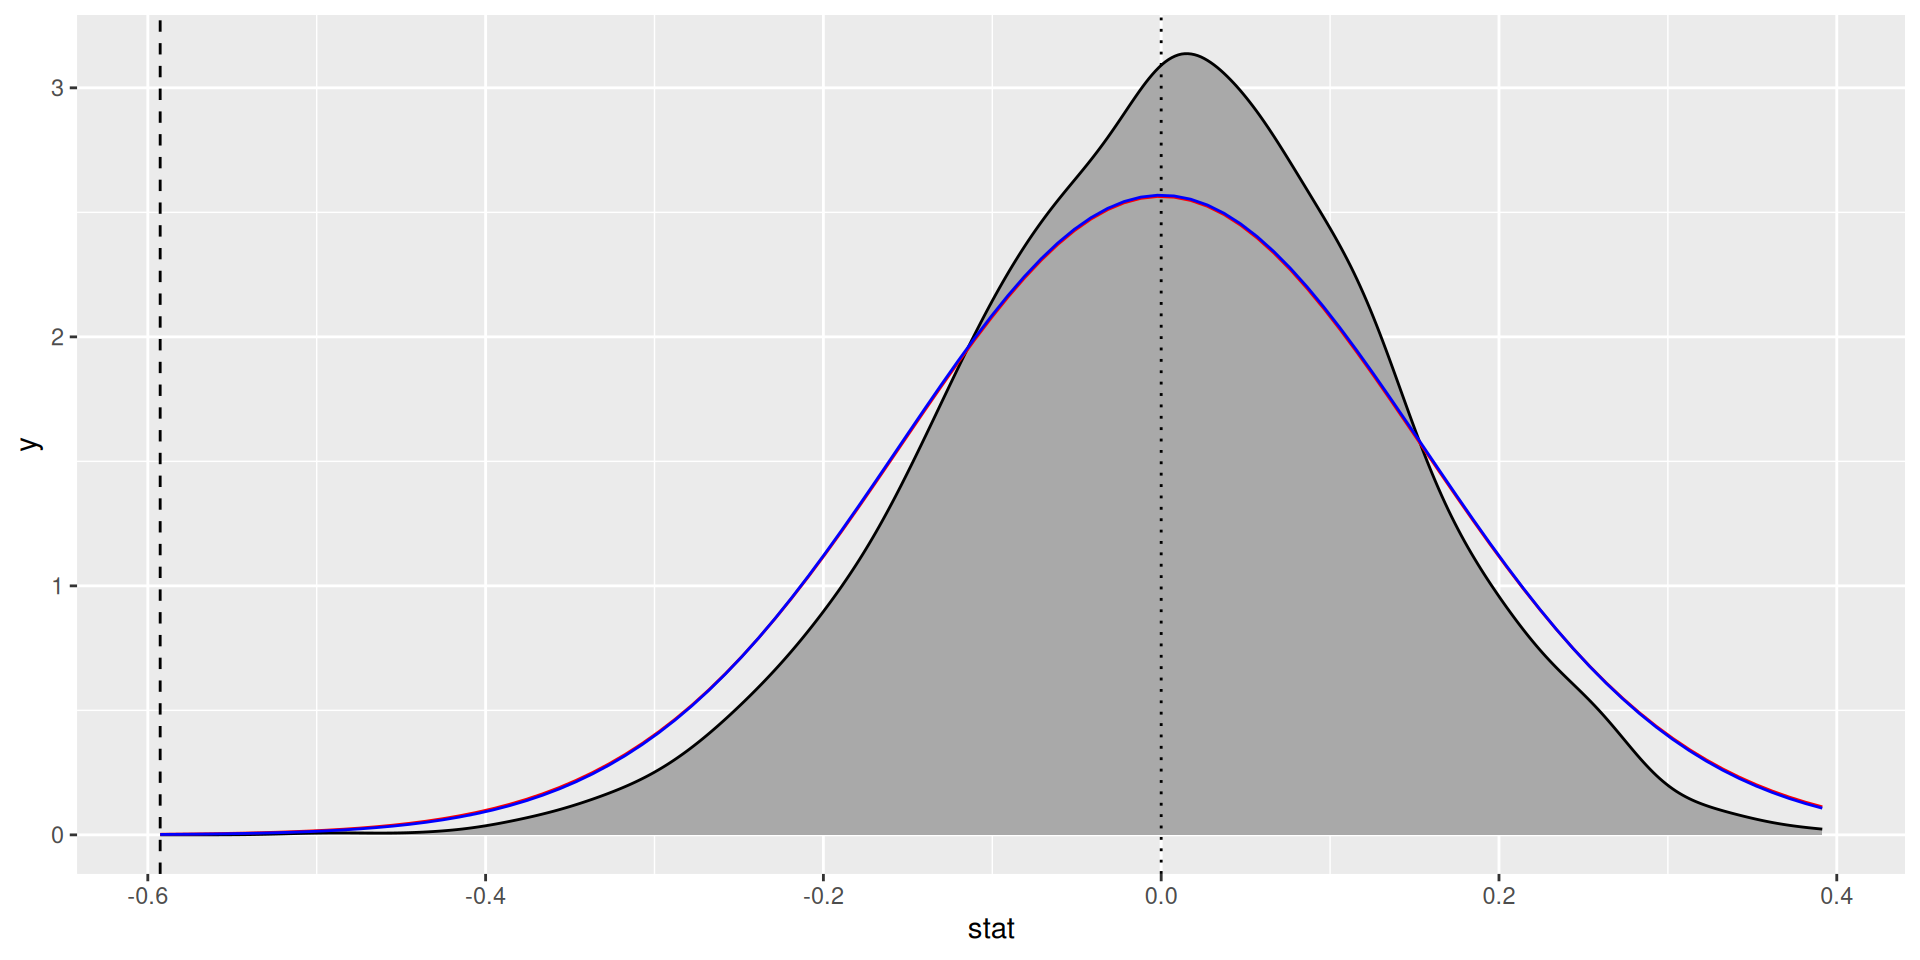
p-values
- Randomization test
# A tibble: 1 × 1
  p_value
    <dbl>
1 0- \(t\)-based approximation
Conclusion
Statistical significance
There is a statistically significant/discernible reduction in the average birthweight of babies born to mothers who smoke.
Practical significance
On average, babies born to mothers who smoke weighed 0.59 pounds less than babies born to mothers who didn’t smoke.
Your turn
See handout
![]()