Diagnose the fit of a segmented time series
diagnose.RdDepending on the input, this function returns a diagnostic plot.
Usage
diagnose(x, ...)

# S3 method for class 'mod_cpt'
diagnose(x, ...)

# S3 method for class 'seg_basket'
diagnose(x, ...)

# S3 method for class 'tidycpt'
diagnose(x, ...)

# S3 method for class 'nhpp'
diagnose(x, ...)
Arguments
- x
A tidycpt object, or a
modelorsegmenter- ...
currently ignored
Value
A ggplot2::ggplot() object
See also
Other tidycpt-generics:
as.model(),
as.segmenter(),
changepoints(),
fitness(),
model_name()
Examples
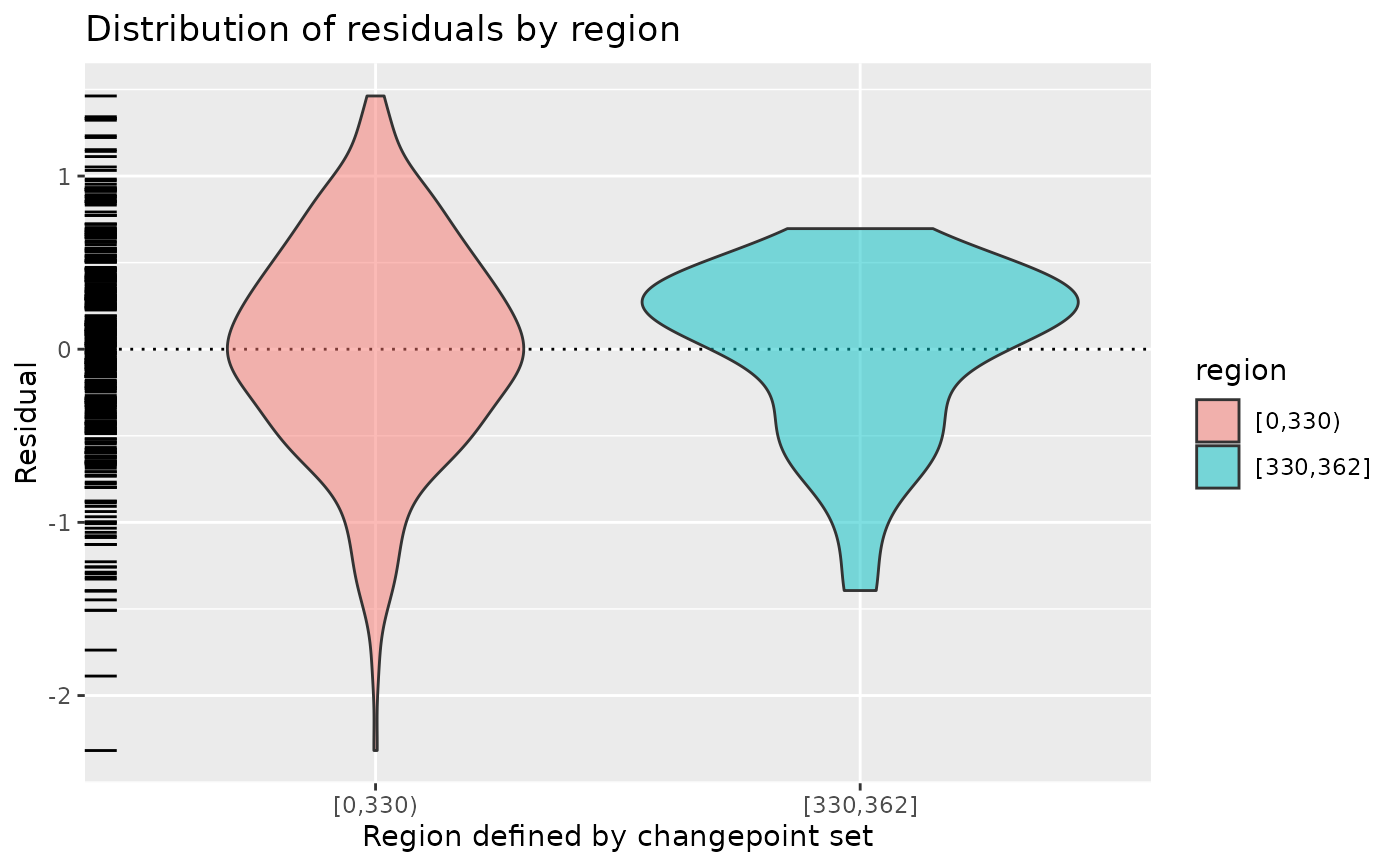
# For meanshift models, show the distribution of the residuals by region
fit_meanshift_norm(CET, tau = 330) |>
diagnose()
 # \donttest{
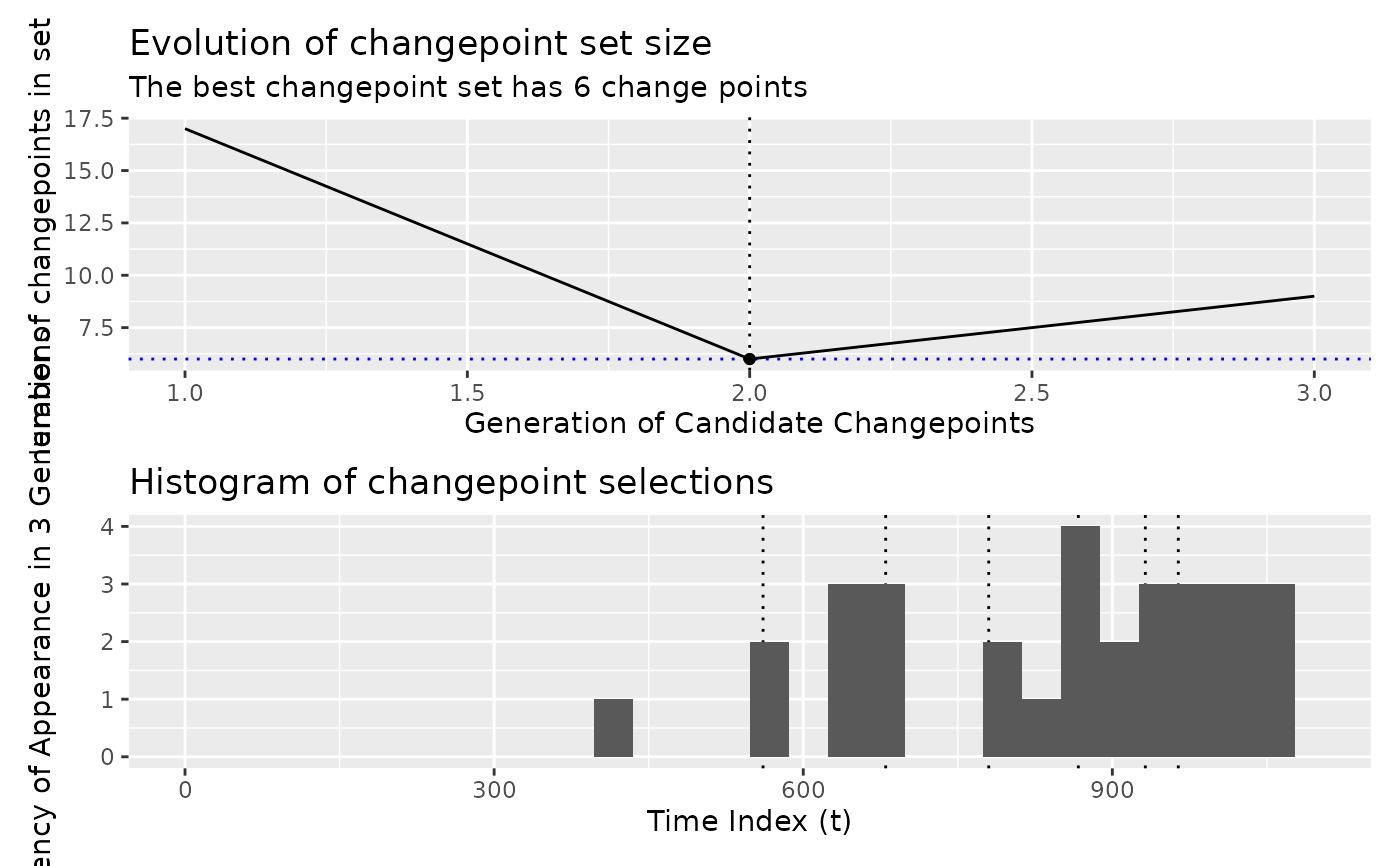
# For Coen's algorithm, show the histogram of changepoint selections
x <- segment(DataCPSim, method = "coen", num_generations = 3)
#> Warning: `segment_coen()` was deprecated in tidychangepoint 0.0.1.
#> ℹ Please use `segment_ga_coen()` instead.
#> ℹ The deprecated feature was likely used in the tidychangepoint package.
#> Please report the issue to the authors.
#>
|
| | 0%
|
|============================== | 50%
|
|============================================================| 100%
x |>
as.segmenter() |>
diagnose()
#> `stat_bin()` using `bins = 30`. Pick better value `binwidth`.
#> Warning: Removed 2 rows containing missing values or values outside the scale range
#> (`geom_bar()`).
# \donttest{
# For Coen's algorithm, show the histogram of changepoint selections
x <- segment(DataCPSim, method = "coen", num_generations = 3)
#> Warning: `segment_coen()` was deprecated in tidychangepoint 0.0.1.
#> ℹ Please use `segment_ga_coen()` instead.
#> ℹ The deprecated feature was likely used in the tidychangepoint package.
#> Please report the issue to the authors.
#>
|
| | 0%
|
|============================== | 50%
|
|============================================================| 100%
x |>
as.segmenter() |>
diagnose()
#> `stat_bin()` using `bins = 30`. Pick better value `binwidth`.
#> Warning: Removed 2 rows containing missing values or values outside the scale range
#> (`geom_bar()`).
 # }
# \donttest{
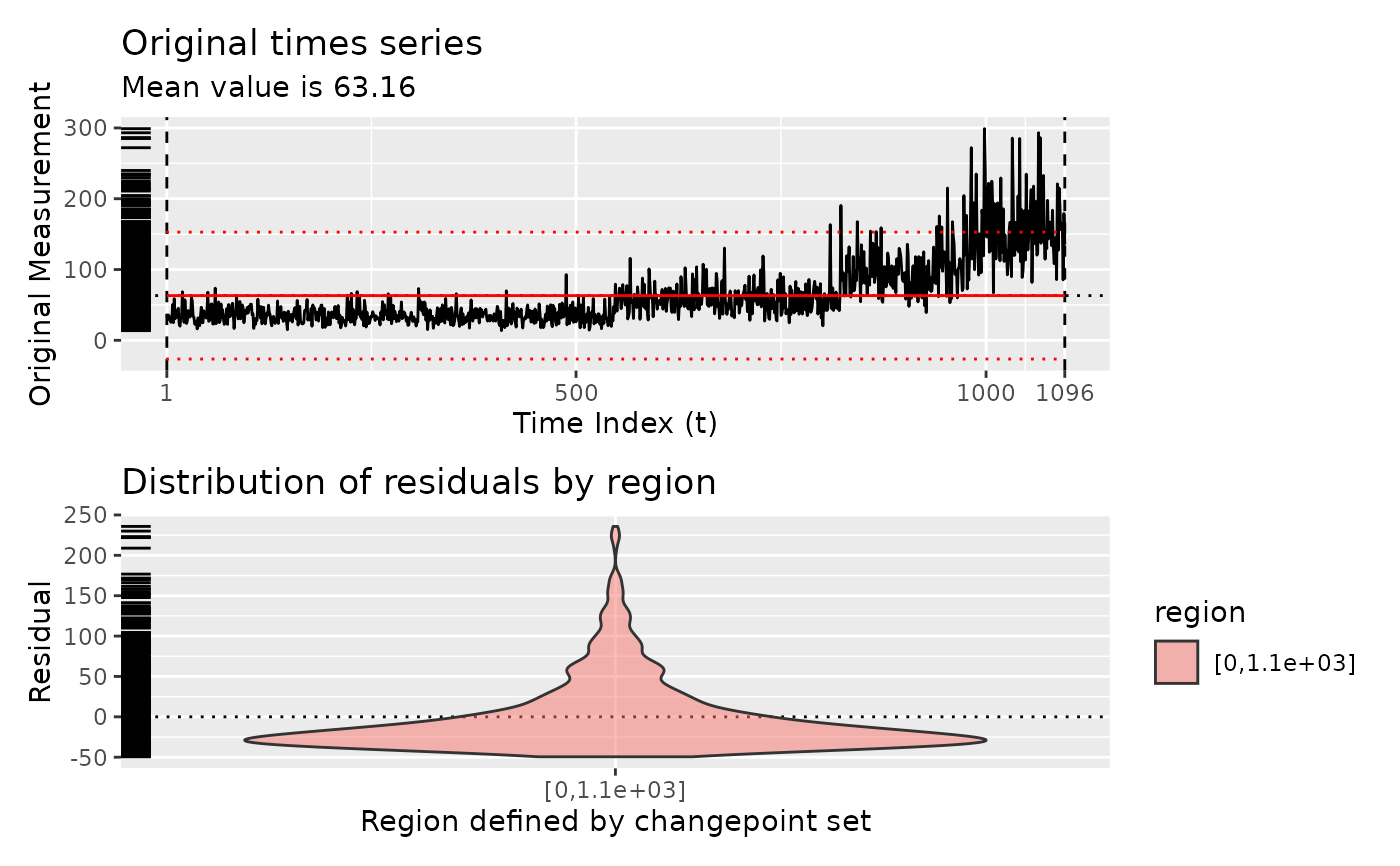
# Show various iterations of diagnostic plots
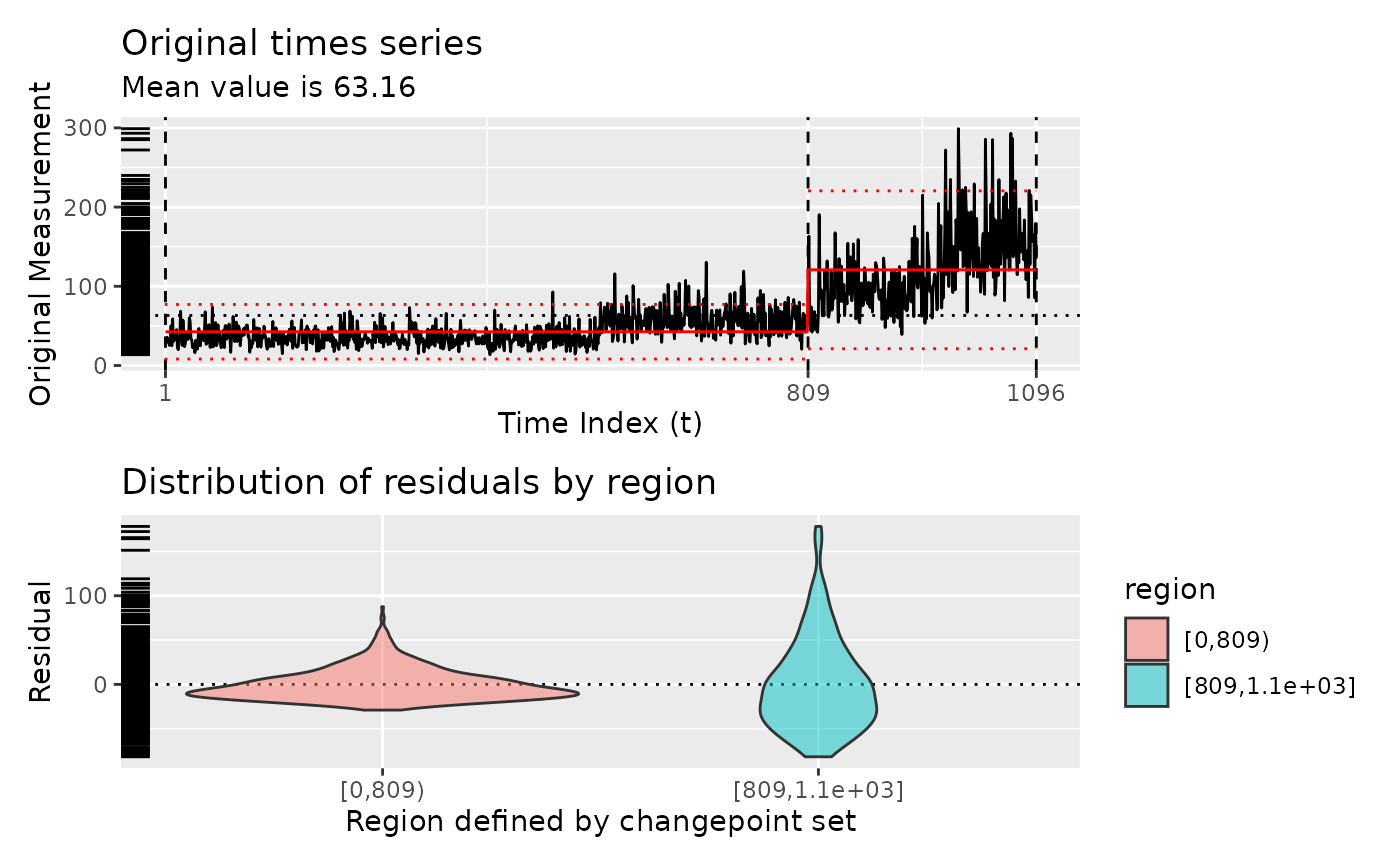
diagnose(segment(DataCPSim))
# }
# \donttest{
# Show various iterations of diagnostic plots
diagnose(segment(DataCPSim))
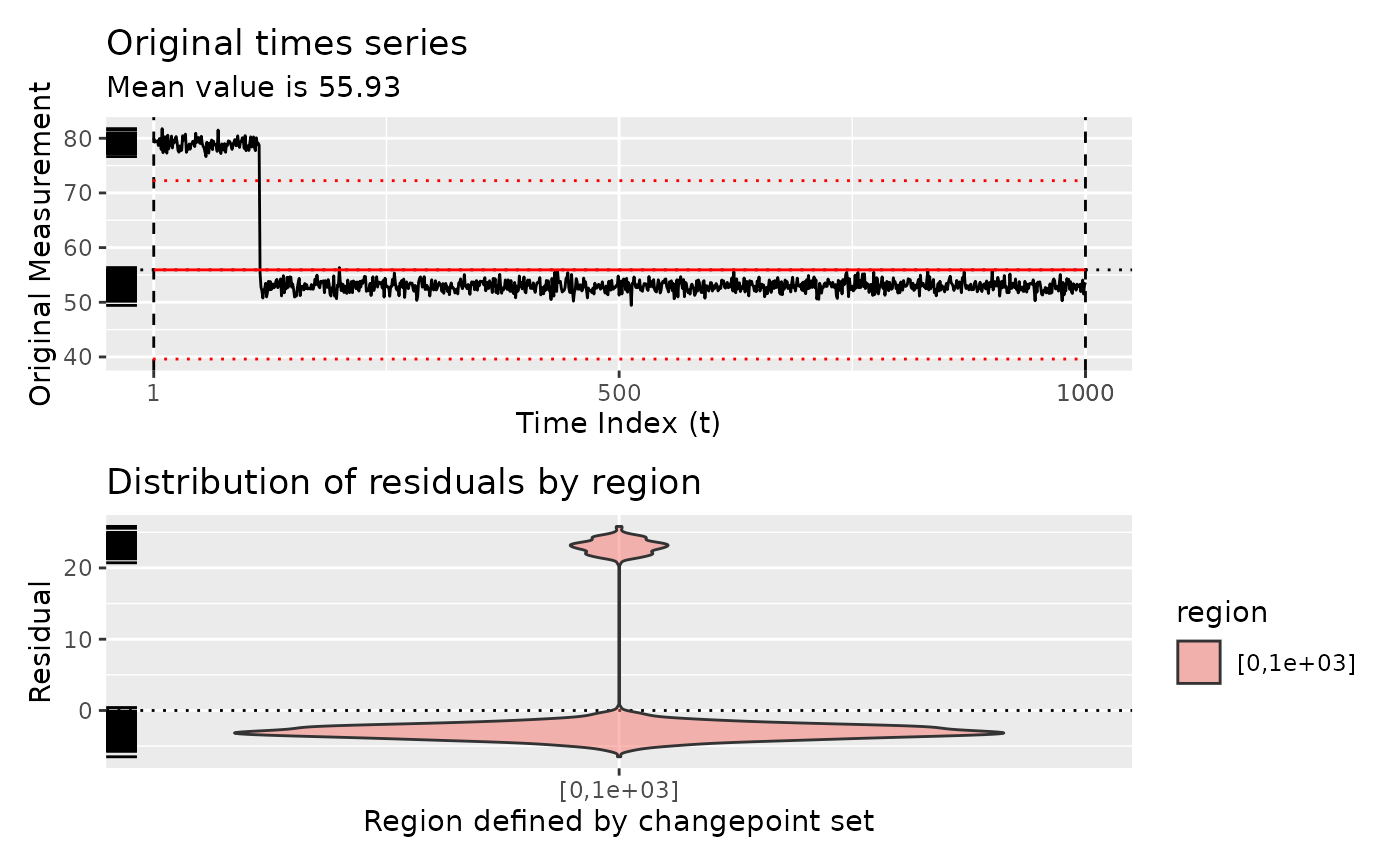
 diagnose(segment(DataCPSim, method = "single-best"))
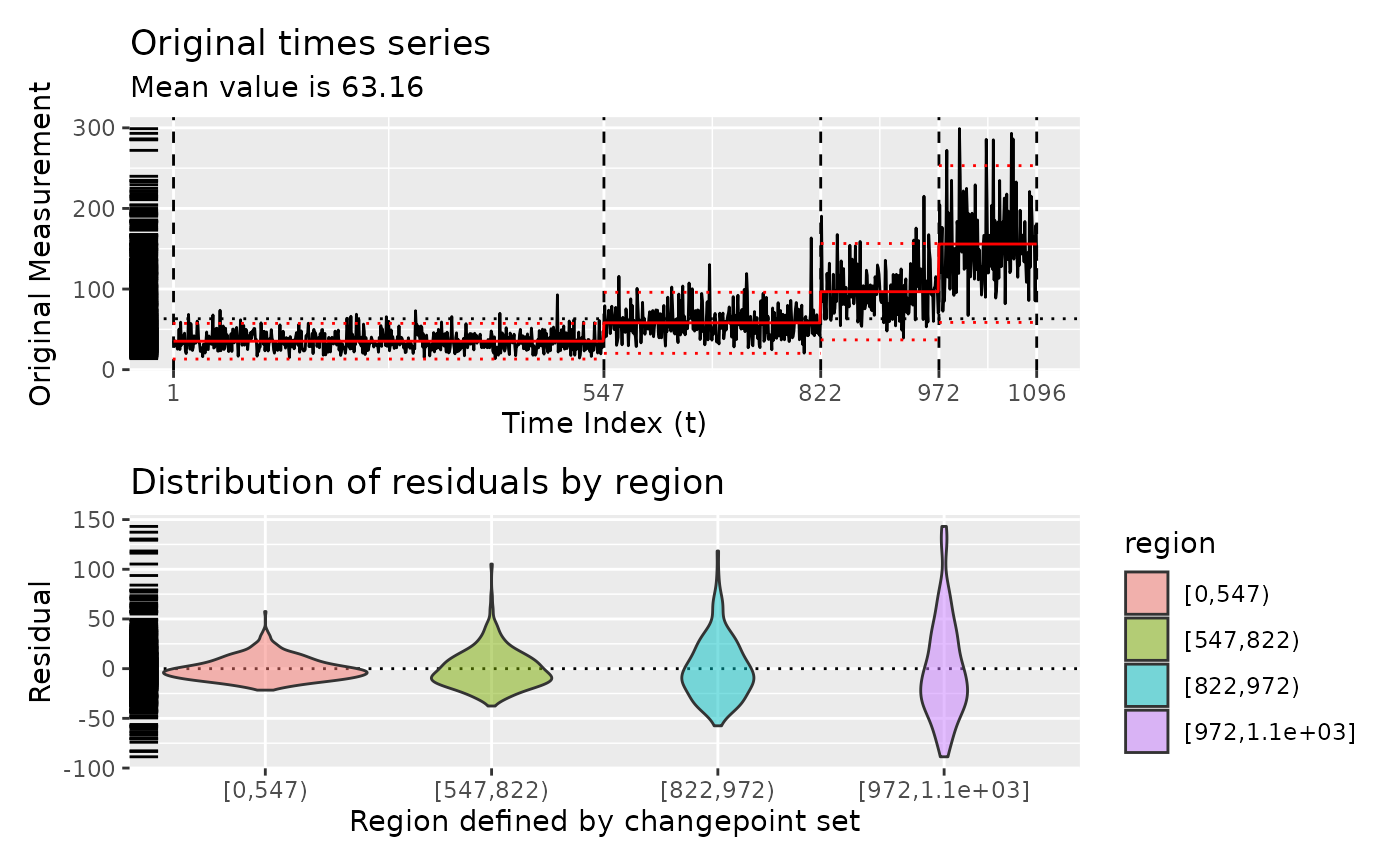
 diagnose(segment(DataCPSim, method = "pelt"))
 # Show diagnostic plots for test sets
diagnose(segment(test_set()))
# Show diagnostic plots for test sets
diagnose(segment(test_set()))
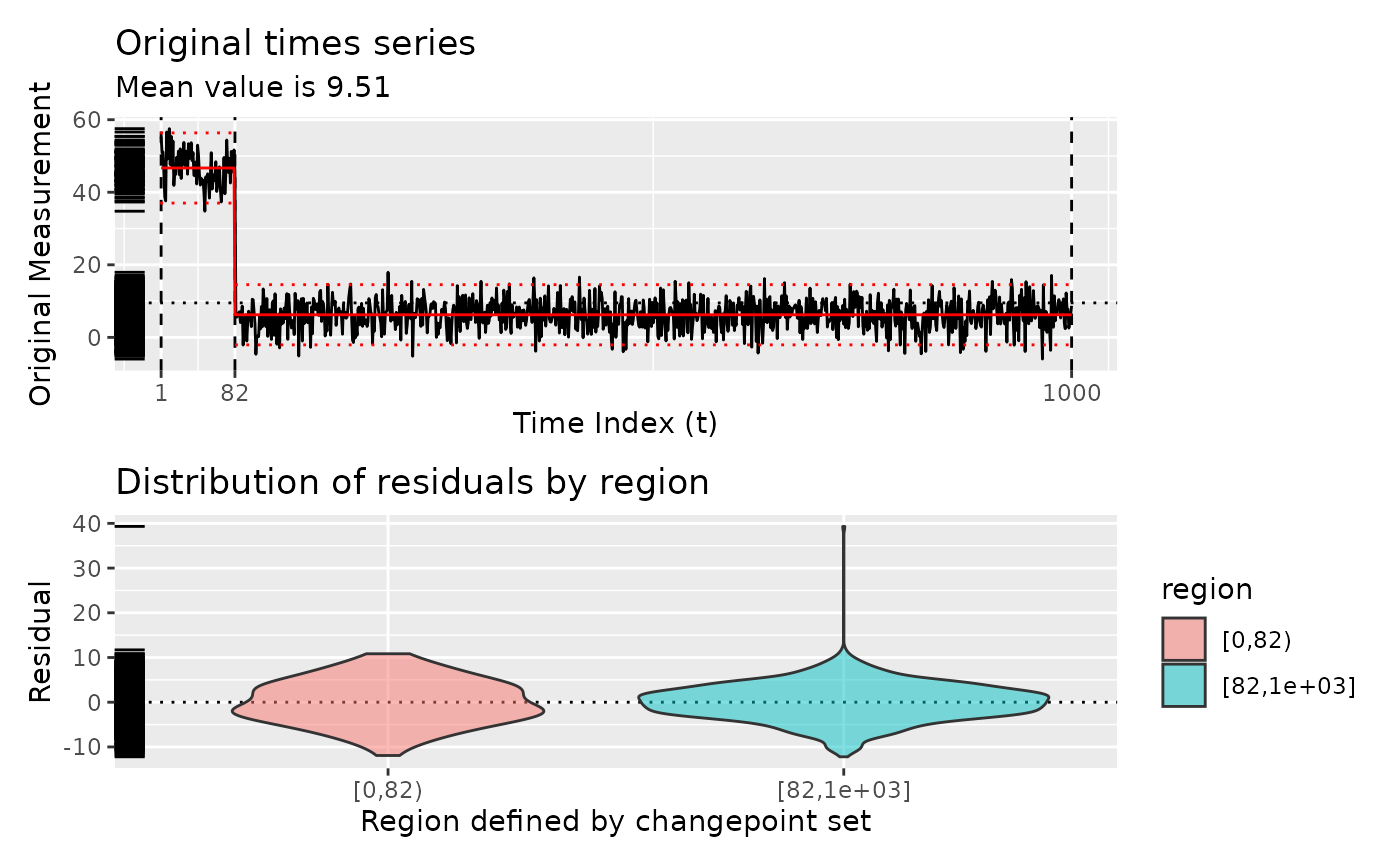
 diagnose(segment(test_set(n = 2, sd = 4), method = "pelt"))
 # }
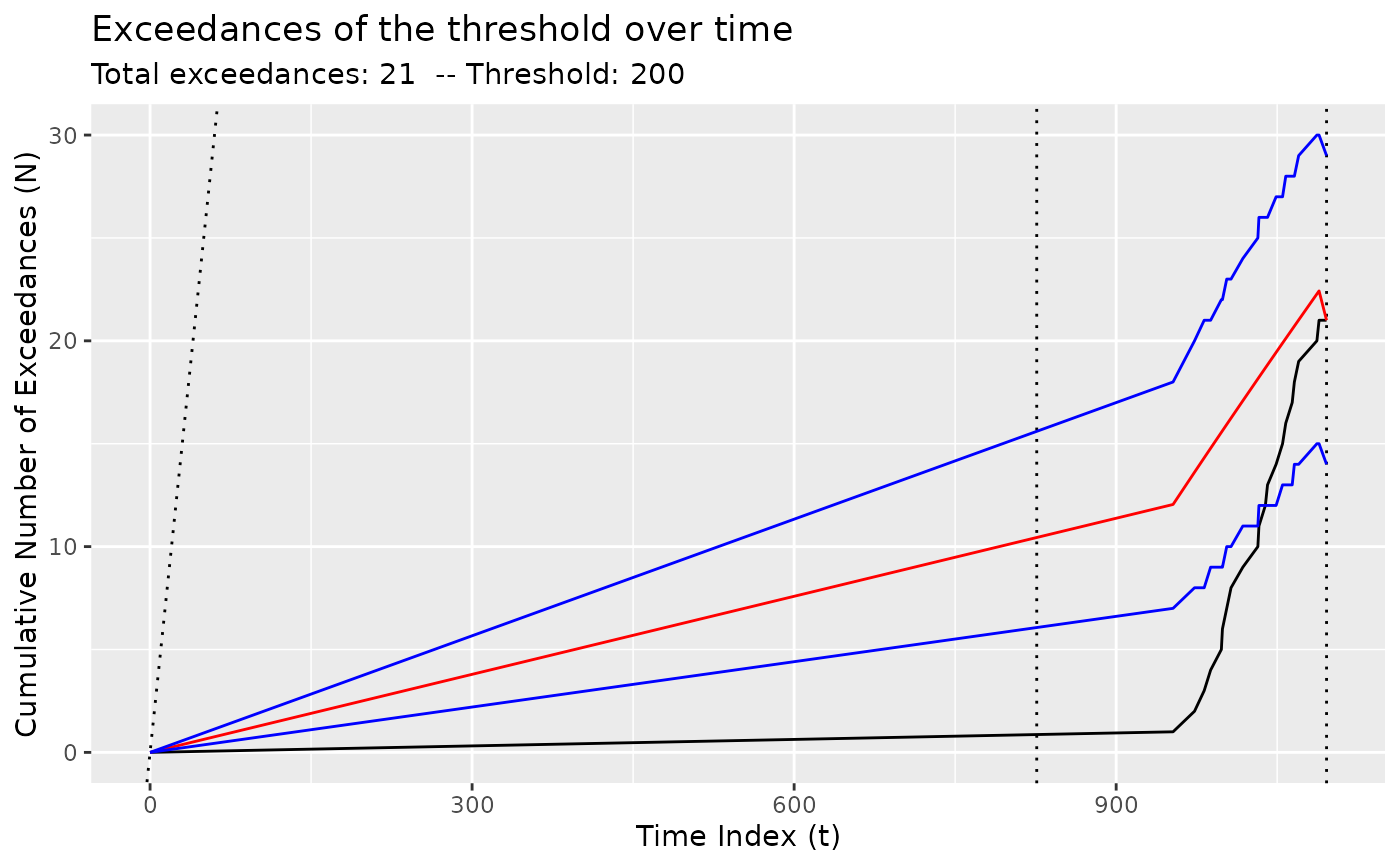
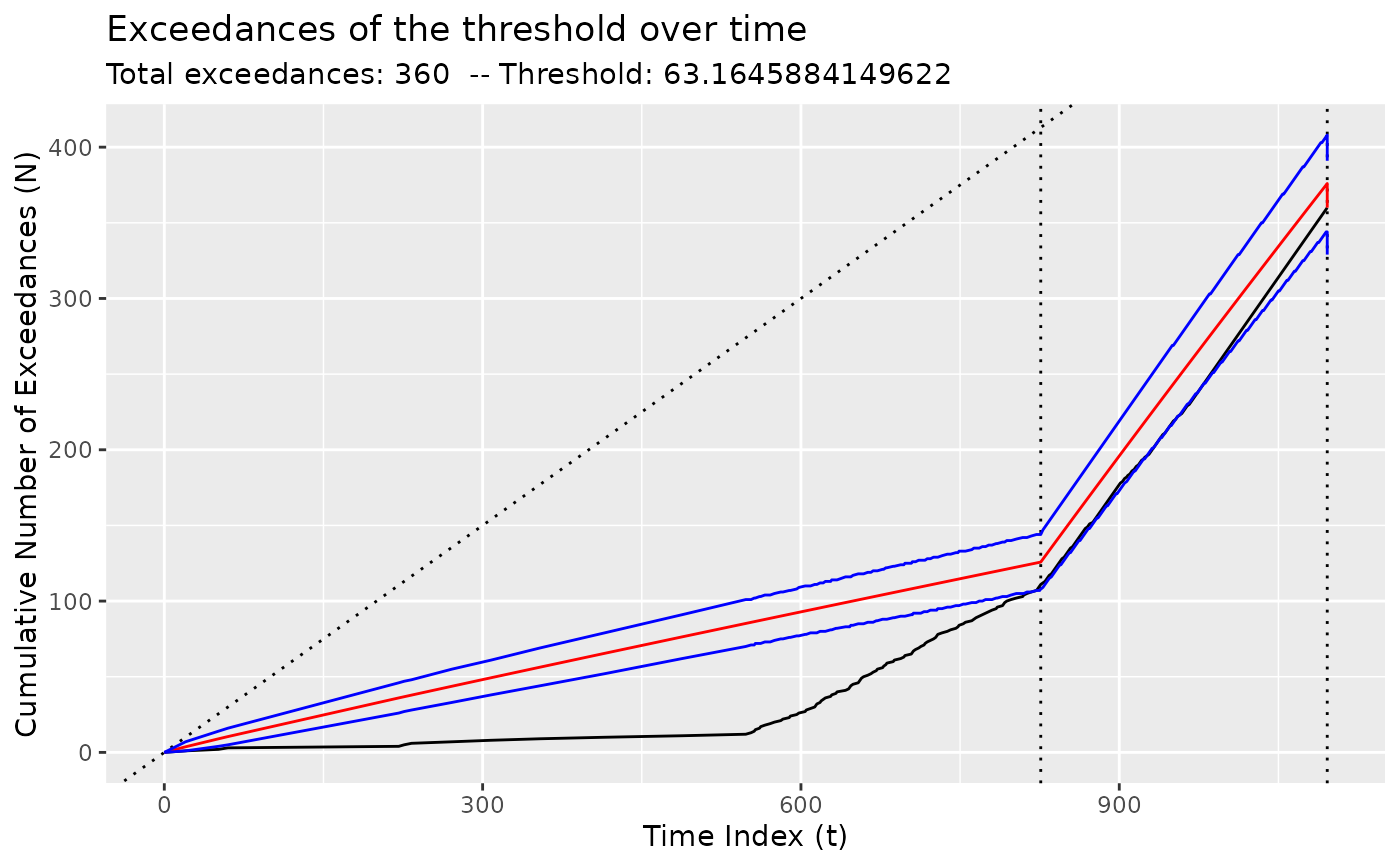
# For NHPP models, show the growth in the number of exceedances
diagnose(fit_nhpp(DataCPSim, tau = 826))
#> Warning: Removed 1 row containing missing values or values outside the scale range
#> (`geom_vline()`).
# }
# For NHPP models, show the growth in the number of exceedances
diagnose(fit_nhpp(DataCPSim, tau = 826))
#> Warning: Removed 1 row containing missing values or values outside the scale range
#> (`geom_vline()`).
 diagnose(fit_nhpp(DataCPSim, tau = 826, threshold = 200))
#> Warning: Removed 1 row containing missing values or values outside the scale range
#> (`geom_vline()`).
diagnose(fit_nhpp(DataCPSim, tau = 826, threshold = 200))
#> Warning: Removed 1 row containing missing values or values outside the scale range
#> (`geom_vline()`).