
---
title: "Home Run Hitting"
author: "Jim Albert"
format:
  revealjs:
    incremental: true
---14 Making a Scientific Presentation using Quarto
Quarto is a new authoring system for producing many different kinds of documents that include dynamic computation of R (or Python) code. In many ways, Quarto is the natural successor to R Markdown. The previous edition of this book was written in LaTeX, with the knitr package providing a mechanism for rendering the R code into LaTeX, which was then compiled into a PDF. However, this book is written in Quarto. This change enables us to simultaneously render the book into multiple formats: in this case, HTML for the website, and PDF for the printed edition.
As noted above, Quarto documents can be rendered to a variety of different formats, including HTML presentations powered by reveal.js, a popular JavaScript library. In this chapter, we illustrate how Quarto can be used to create a professional quality reproducible scientific presentation.
14.1 Introduction to Slides in Quarto
Like all Markdown documents, Quarto documents have a YAML header, followed by various sections of Markdown code. In the example below, the YAML header appears at the top of the document, enclosed by --- on the first line and --- on the 4th line. Various options can be specified in the YAML section. In this case, we specify the author, title, and (importantly) the format. Note that revealjs is nested within format, and that incremental is nested within revealjs. What we are saying is that we want the incremental property, which is available within the revealjs format, to be set to true. In Quarto, it possible to specify different options for multiple formats simultaneously.
Next, we create slides using Markdown section headers and regular Markdown content. For example, the following Markdown code creates a slide titled “Baseball” that contains a list of two players: Mickey Mantle and Aaron Judge.
## Baseball

- Mickey Mantle
- Aaron Judge
In Section 14.2, we create a complex set of slides, based on extensions of these simple principles.
14.2 Example: Jim’s Presentation on Home Run Hitting
In this section, we will walk you through the creation of a scientific presentation constructed in Quarto and output as HTML using the reveal.js framework. The full presentation as Jim gave it is available at: https://bayesball.github.io/homerun_talk/homeruns.html. A slightly modified version that is consistent with the content presented here can be viewed at: https://beanumber.github.io/abdwr3e/revealjs/hr_pres.html
14.2.1 Sections of presentation
First, we decide to divide the presentation into three sections, one introducing general patterns of home run hitting in baseball history, another describing the findings of the 2017 MLB Home Run Committee (Albert et al. 2018), and finally a section describing recent changes in the pattern of home run hitting during the Statcast era.
We create separate slides with these section titles by use of level 1 headings (#):
# Introduction

# What is Causing the Increase in Home Rate Rates?

# Recent Exploration of Home Run Rates
14.2.2 Including R output
One attractive aspect of using Quarto in creating presentations is the ability to incorporate R code and output into a document. As an illustration, suppose we are interested in describing the dramatic change in home run hitting over Major League Baseball history by graphing the number of home runs hit per team per game against season. We use the Lahman database to retrieve these data.
In the Quarto document, we display the R code within chunks demarcated by the ```{r} and ``` symbols. The compiled document contains the ggplot2 graph displayed below. By using the echo: true option, the R code is included in the compiled document. In the case of a presentation, we would generally use the echo: false option so the code would not be shown. You can see the full slide in Jim’s presentation.
```{r}
#| echo: true
library(Lahman)
br <- Batting |>
  group_by(Year = yearID) |>
  summarize(HR = sum(HR))
ggplot(br, aes(Year, HR)) +
  geom_point(color = "black", size = 2) +
  geom_smooth(
    formula = "y ~ x", color = "blue",
    se = FALSE, method = "loess",
    span = 0.20, linewidth = 1.5
  ) +
  labs(x = "Season", y = "Avg HR") +
  theme(text = element_text(size = 22))
```
14.2.3 Multiple columns and adding images
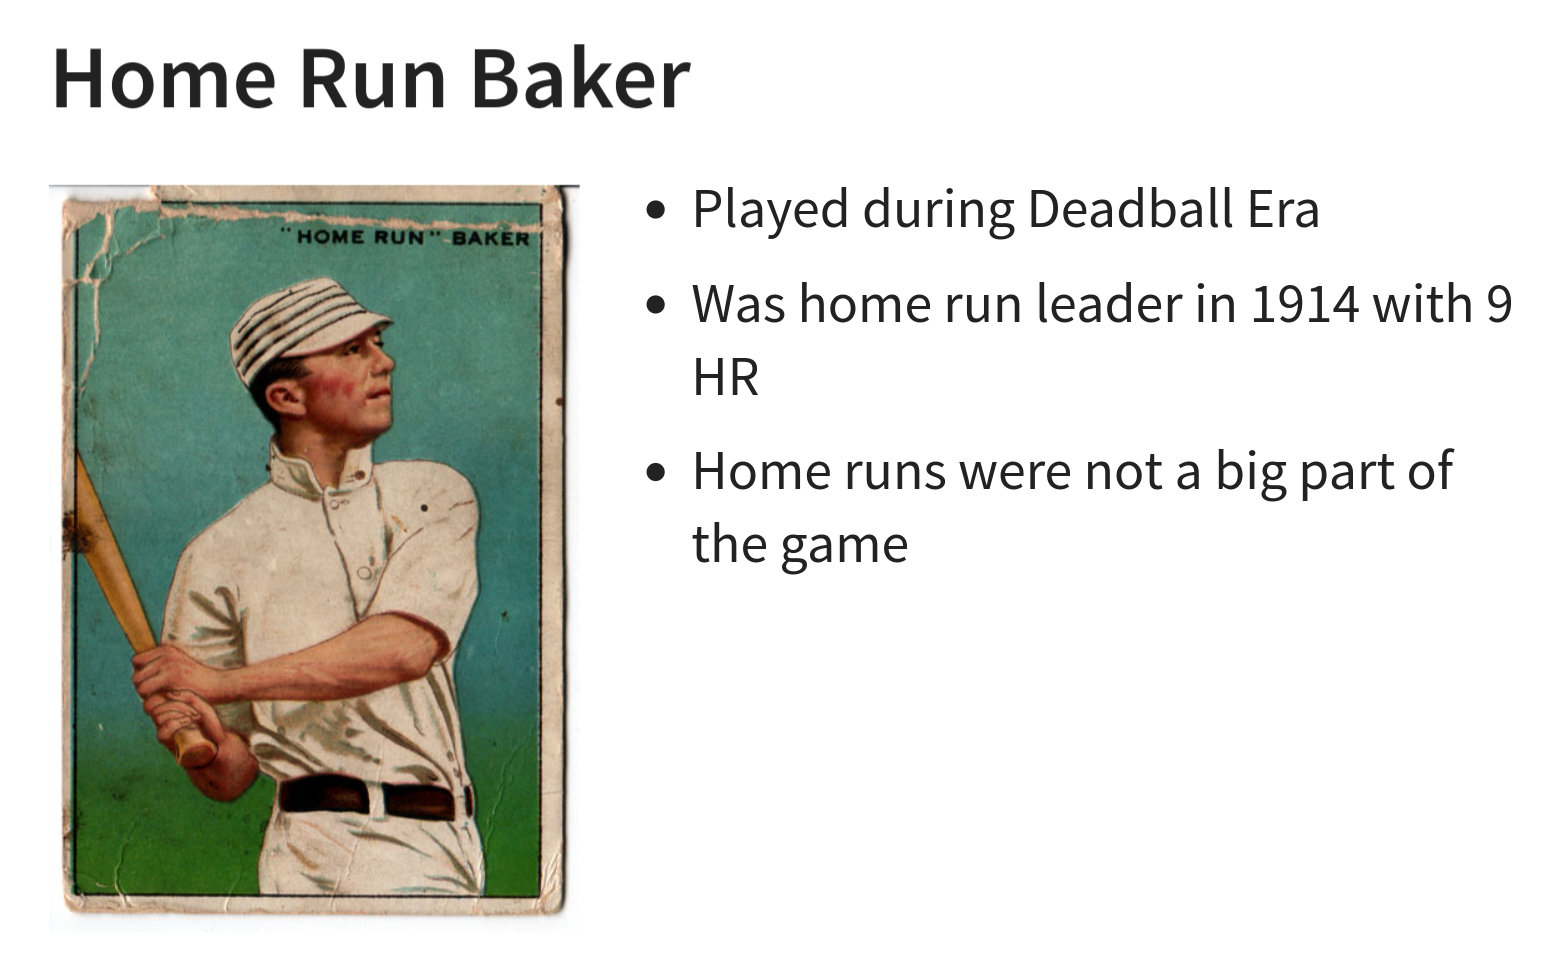
Part of the presentation is describing some of the famous home run hitters in baseball history. The image file at the URL below contains a picture of Home Run Baker. Note that unlike Beamer presentations in LaTeX (see Section 14.3), images in reveal.js presentations can be sourced directly from the Internet. We include this image in the presentation by use of the  syntax where url indicates the location of the folder containing the image.
The Quarto code also illustrates the use of a two column format where the left column contains the image and the right column gives a brief description of the player. The .column width argument describes the percentages for the widths of the left and right columns.
## Home Run Baker
:::: columns
::: {.column width="40%"}

:::
::: {.column width="60%"}
- Played during Deadball Era
- Was home run leader in 1914 with 9 HR
- Home runs were not a big part of the game
:::
::::Figure 14.1 shows the completed slide of the compiled presentation.
14.2.4 Including a table
It is easy to include a table into the presentation by use of standard Markdown methods. Here we create a table displaying the total home run counts for the seasons 2015 through 2022 using the common Markdown pipe format. The resulting slide is shown in Figure 14.2.
## Home Run Totals in the Statcast Era

| Season | HR Total |
|--------|----------|
| 2015   | 4909     |
| 2016   | 5610     |
| 2017   | 6105     |
| 2018   | 5585     |
| 2019   | 6776     |
| 2021   | 5944     |
| 2022   | 5215     |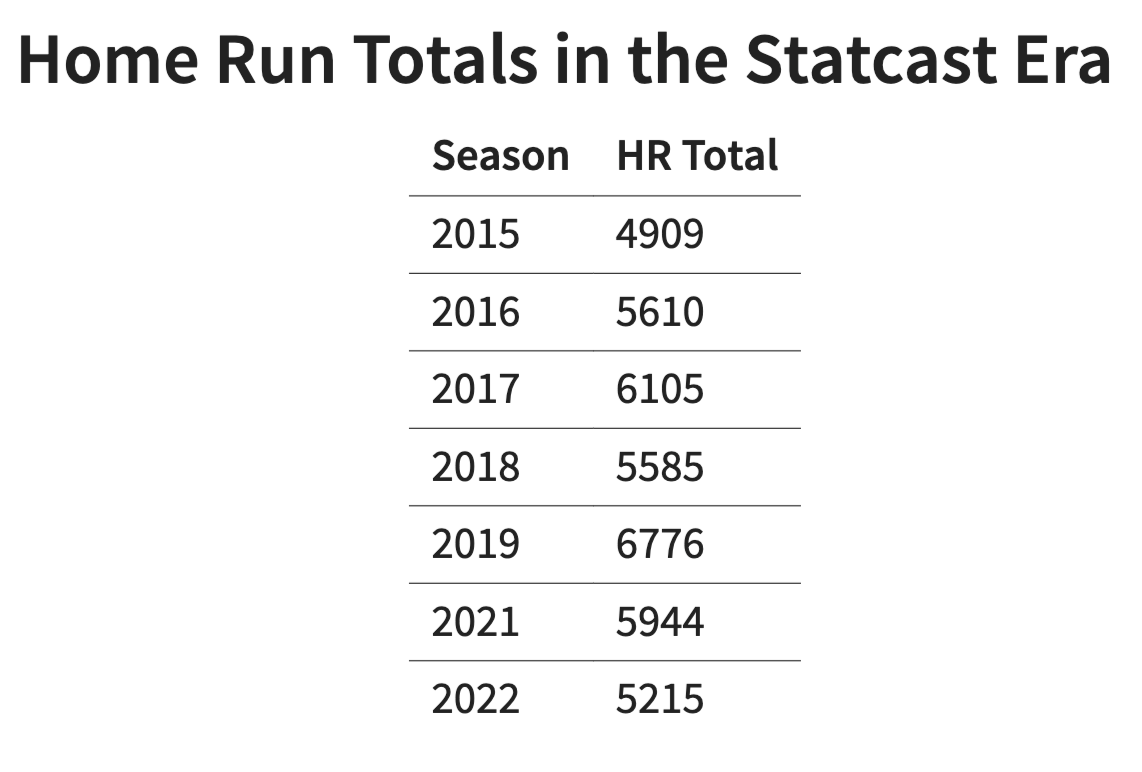
An alternative method for displaying a table uses the kable() function in the knitr package. The table data is placed in a data frame by use of the tibble() function. In the kable() function, we choose a “simple” format, align both columns to be centered, and add special names for the columns. Below we show the code to implement this R work and then display the output in Table 14.1.
```{r}
#| echo: false
df <- tibble(
  Season = c(2015, 2016, 2017, 2018, 2019, 2021, 2022),
  HR_Total = c(4909, 5610, 6105, 5585, 6776, 5944, 5215)
)
df |>
  knitr::kable(
    "simple", align = "cc",
    col.names = c("Season", "Home Runs")
  )
```kable().
| Season | Home runs |
|---|---|
| 2015 | 4909 |
| 2016 | 5610 |
| 2017 | 6105 |
| 2018 | 5585 |
| 2019 | 6776 |
| 2021 | 5944 |
| 2022 | 5215 |
14.2.5 Including LaTeX
Another attractive feature of Quarto documents is the ability to incorporate LaTeX, which is a venerable system for displaying mathematical formulas. A LaTeX equation can be placed within the $$ delimiters. Here we use LaTeX to display the formula for the in-play home run rate. Below the Quarto code, Figure 14.3 shows a snapshot of the slide containing the mathematical expression.
## In-Play Rates

-   Define the home run rate as the fraction of $HR$ among all
    batted balls ($AB - SO$)
$$
HR \, Rate = \frac{HR}{AB - SO}
$$
-   Look at history of $HR$ rates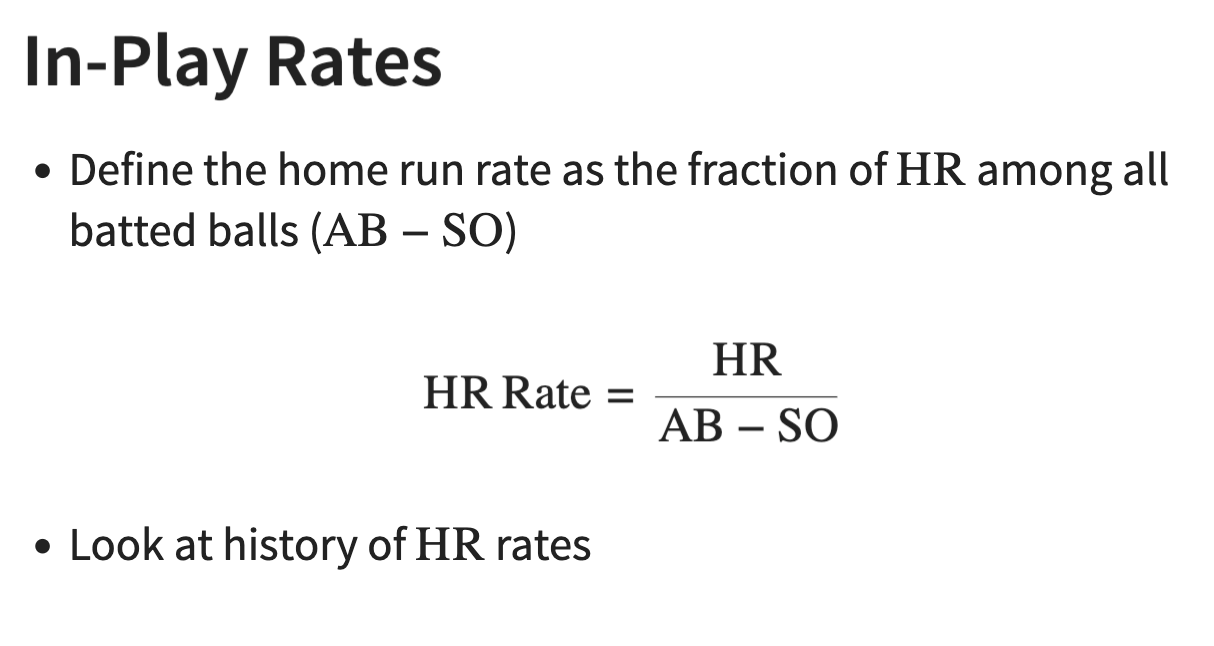
LaTeX.
14.2.6 Options using the revealjs format
The revealjs format (resulting in reveal.js presentations) allows for a wide variety of options. The website https://quarto.org/docs/presentations/revealjs/ provides an overview of all the capabilities of this particular presentation format.
There are many advanced features, including the ability to create animations, zoom in and out, include slides numbers, print to PDF, and a Chalkboard feature that allow you to draw on a slide.
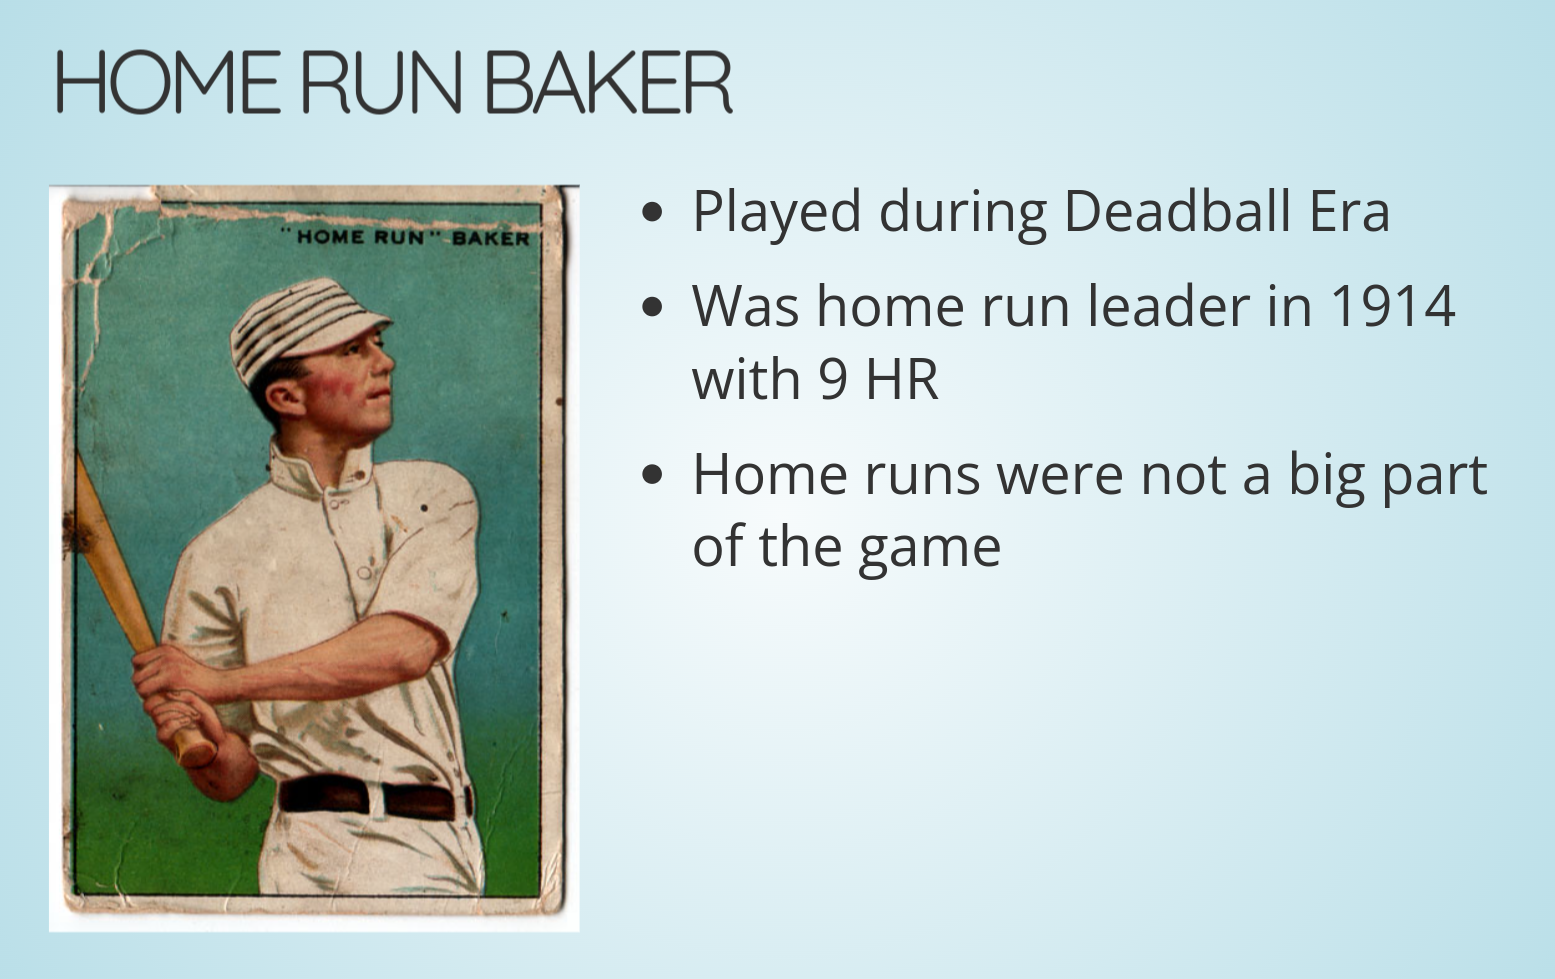
There are 11 built-in themes for Reveal presentations—snapshots from the default theme have been presented up to this point. One can use the sky format by use of the following YAML header. A snapshot of the Home Run Baker slide is displayed using this theme in Figure 14.4.
---
title: "Home Run Hitting"
author: "Jim Albert"
format:
  revealjs:
    incremental: true
    theme: sky
---
sky theme.
14.3 Alternative Output Formats
We have focused on the use of the revealjs output format where the presentation output is an HTML file. Other popular formats are Beamer (where the output is a PDF file) and PowerPoint (where the output is a .pptx file).
These alternative formats require only small changes to the YAML header. For example, suppose one wishes to create a PDF of our home run presentation using the Beamer LaTeX class. In the YAML header, we indicate as an option to format that we wish to use the beamer class. In the options to beamer, we indicate we want to have incremental lists and use the Boadilla beamer theme with a seahorse color theme.
---
title: "Home Run Hitting"
author: Jim Albert
format:
  beamer:
    incremental: true
    theme: Boadilla
    colortheme: seahorse
---
Instead, suppose we wish to have PowerPoint output. We indicate below that the format is pptx with incremental lists. No other changes to the presentation content are necessary!
---
title: "Home Run Hitting"
author: Jim Albert
format:
  pptx:
    incremental: true
---
By default, PowerPoint will use a relatively plain looking template. You can modify this by creating a PowerPoint template and using the reference-doc option to use this template.
14.4 Further Reading
The official Quarto documentation provides an introduction to the HTML, PowerPoint and Beamer formats for creating presentations. The reveal.js site provides more details on the use of the reveal.js presentation framework.
14.5 Exercises
1. Home Run Hitting in Recent Years
Use the Lahman package and write R code that will generate the table of the total number of home runs hit from 2015–2022. Put the table on a slide as we have done in Section 14.2.4.
2. Home Run Hitting in Recent Years (continued)
Use the Lahman package and write R code that will display the home run rate on balls in play (HR / (AB - SO)) for seasons 2000–2022 as a function of the season. Put the figure on a slide as we have done in Section 14.2.2.
3. Should the Player be in the Hall of Fame?
Select a player who you believe should be in the Baseball Hall of Fame. Make a presentation that compares your player with another player at the same fielding position who is currently in the Hall of Frame. Your presentation should include graphs, tables and images of both players.
4. Leaderboard Presentation
Make a presentation that presents the top-ten career leaders with respect to some batting or pitching measure. This presentation should include an R scatterplot that displays the career measure against the midcareer season for the ten players. Also include images of the ten players in the leaderboard together with some information about the players.